Using the SSA5000A pulse measurement option
February 3, 2024
1 Introduction
RF pulse signals are widely used in pules modulated and testing of pulse signals is necessary for engineers working in related fields. In some critical areas such as signal design and verification require integrated time domain/frequency domain/modulation test tools for pulse signal analysis. SIGLENT SSA5000A’s Pulse function provides pulse analysis that can help engineers better analyze today’s dynamic signal environment.
2 Characterization of Pulse Signals
Figure 2–1 shows the simplest way to generate RF pulse signals. The pulse modulator can be understood as a switch. The baseband pulse controls the on and off of the signal, thereby converting the input CW signal into a radio frequency pulse signal. This process can also be understood as the time domain multiplication of CW signal and baseband pulse signal.
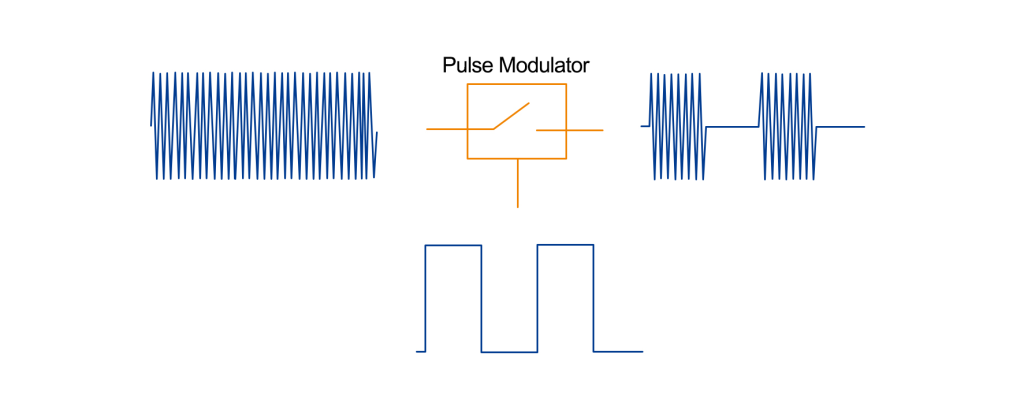
Figure 2–1 pulse modulated signal
Multiplication of two signals in the time domain is equivalent to the convolution of their spectra. The spectrum of the CW signal is theoretically a single spectrum line. According to the spectrum of the baseband pulse signal, the spectrum of the radio frequency pulse signal can be obtained as shown in Figure 2–2.
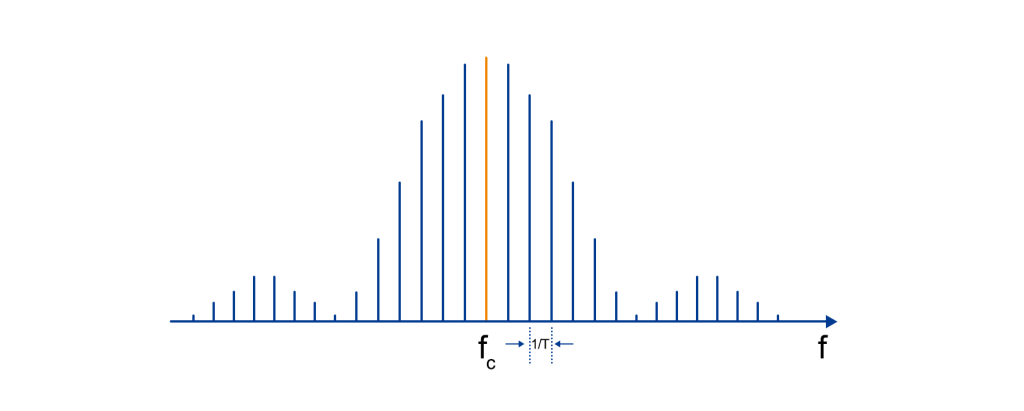
Figure 2–2 spectrum of radio frequency pulse signal
The pulse-modulated signal is a periodic signal, and its spectrum is a discrete spectrum. The amplitude of each spectral line changes according to the Sinc function. The spacing between neighboring spectral lines is the reciprocal of the baseband pulse period T. When actually testing with a spectrum analyzer, the envelope spectrum or line spectrum can be shown by setting different RBW. When the RBW is smaller than the spectral line spacing, a line spectrum is obtained; when the RBW is gradually increased, it is gradually shown as a pulse envelope spectrum.
In terms of the time domain, the greatest characteristic of the pulsed signal is the discontinuity in time domain. Burst characteristics in the time domain is a basic requirement for pulsed use and therefore the pulse signal parameters are also the main metrics for pulse signal quality assessment. The time-domain discontinuity of pulsed signals also adds to the difficulties in power and spectral testing.
In this note we will discuss time and frequency domain testing of pulses.
3 Analysis pulses by using the Pulse Function of the SSA5000A
3.1 Configure the SSA5000A
As a universal instrument that can handle both spectral power and bandwidth analysis, the spectrum analyzer can be used for power testing while observing the spectrum if there are no especially demanding requirements for accuracy. The pulse function of the SSA5000A can be used to measure pulse width, amplitude and time parameters. In the pulse analysis function, the spectrum analyzer is in zero-span mode. At this time, the spectrum analyzer is equal to a peak power meter, which can be used to detect the envelope of the signal at a specific frequency point with a certain bandwidth and draw the time-dependent power curve. In this case the RBW of the spectrometer is equivalent to the bandwidth of this detector. The spectrometer in zero span mode will pin the local oscillator at the center frequency, so we need to set the center frequency correctly in the frequency settings when performing pulse analysis. Actually, if the center frequency is offset a little from the actual carrier frequency, you may also get an acceptable test result, that’s because most of the power of the pulse signal can pass through the IF filter.
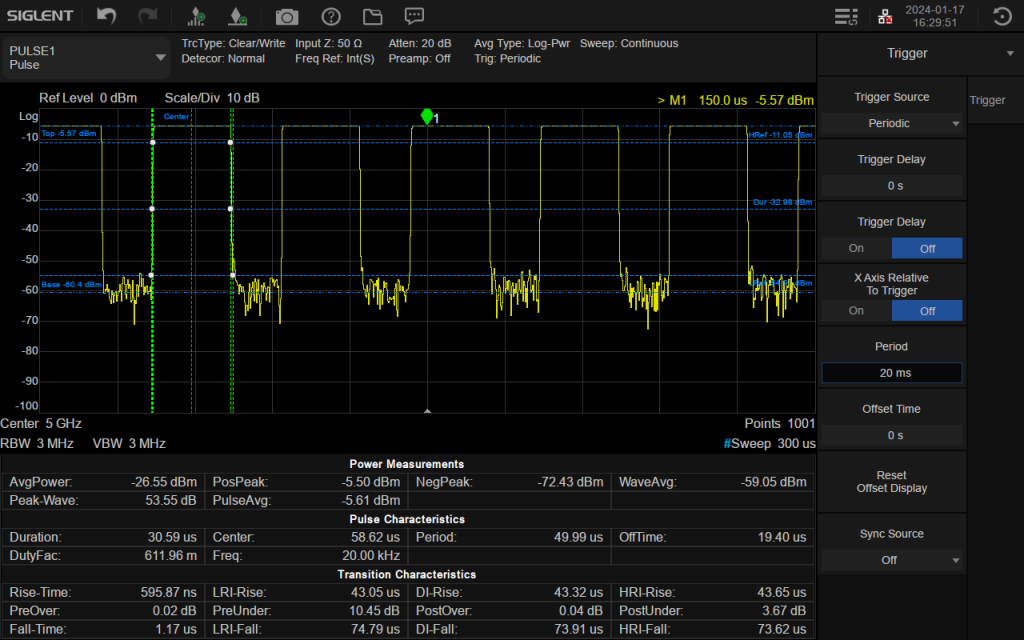
Figure 3–1 test result of pulse test
The test results are shown in Figure 3–1, where the horizontal axis of the spectrometer is time and the vertical axis is power. The analyzer will automatically recognize the rising and falling edges of the pulse signal and calculate the power and rise/fall time during pulse switch. For narrow pulses, you can increase the analyzer’s RBW for more accurate measurements. In fact, the rise time measured by the analyzer generally can’t be better than the optimal rise time of the spectrum analyzer. The rise time of the analyzer is determined by the following formula: Tr=0.66/max RBW. The maximum RBW of the SSA5000A is 10MHz, which means that the rise time of the pulse must be greater than 66ns otherwise the analyzer won’t give a correct result. For the line spectrum test, the VBW setting does not have much effect on the test results of the spectrum, but for the pulse test, the VBW should not be smaller than the RBW, otherwise it will result in a lower peak power. The VBW filter filters the envelope of the signal passing through the IF filter. While in pulse test, where multiple spectral lines pass through the IF filter at the same time, the synthesized envelope has it own bandwidth, and if the bandwidth is greater than the VBW bandwidth, the test result will be decreased. Generally, when testing sinusoidal signals, the VBW:RBW is selected from 1 to 3, while testing pulse signals, the VBW:RBW is generally selected 10 to minimize the effect on signal amplitude.
For pulse signals with known period, you can select periodic trigger in Trigger and set the trigger Period and pulse period to be the same. Thus, you can get a stabilized triggered pulse signal.
3.2 Result analysis
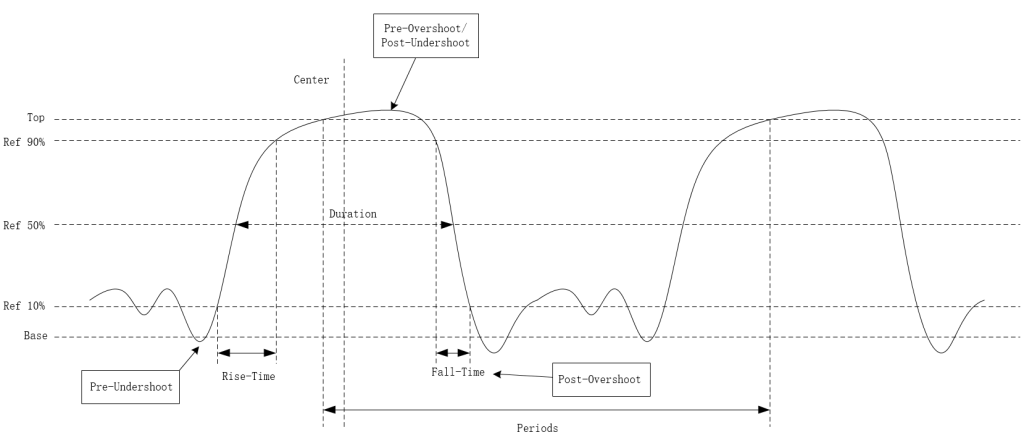
Figure 3–2 Pulse Signal Schematic
The schematic diagram of the pulse is shown in Figure 3–2, from which the individual results of the pulse measurement can be clearly seen. In the power measurements result Pospeak is the highest level on the trace and NegPeak is the lowest level on the current trace. The spectrum analyzer calculates Amptmid = (PosPeak – NegPeak) / 2 + NegPeak. When a trace continuously passes through the pulse low reference (RefLow, 10%), pulse continuous reference (RefDuration, 50%), pulse high reference (RefHigh, 90%) (referred to as the rising edge), or when it passes through these three reference amplitudes in the opposite direction (referred to as the falling edge), mark this trace as the edge of the pulse. For a complete measurement of the parameters of the pulse, at least 3 edges are required. In pulse characteristics the pulse duration is the time difference between a positive pulse (negative pulse) passing through the pulse duration reference (RefDuration, 50%) on the rising edge (falling edge) and a falling edge (rising edge) passing through the pulse duration reference (RefDuration, 50%).
Pulse Off Time = Pulse Period – Pulse Duration. The duty cycle and frequency of the pulse can be calculated from the period and pulse width.
In the conversion characteristics, the rise-time is the time spent between the first rising edge of the pulse crossing RefLow and crossing RefHigh, and the fall time is the time spent between the first falling edge of the pulse crossing ReHigh and crossing RefLow. And the analyzer will automatically calculate the Pre-Overshoot, Pre-Undershoot, Post-Undershoot and Post-Overshoot of the pulse in dB.
4 Analyze the Spectrum of a Pulse Signal Using SSA5000A
4.1 Measure the pulse spectrum using the swept SA
Measuring the pulse spectrum by sweeping Spectrum Analyzer is the classic way which is commonly used by engineers in the last decades. This method is suitable for observing stable pulse signals with known pulse width and period. However, due to the limitation of the sweeping speed of the swept frequency spectrum analyzer, the analyzer has limit to track and capture the transient signals, and cannot observe the shortcut pulse signals and broadband modulated pulse signals well. When observing the Linear Spectrum using a sweep, we need to set the RBW smaller. However, when the RBW is small, the speed of data acquisition is much faster than the speed of digital processing speed, so it has a long dead time, and if there are some short disturbances, it is likely that these signals will be missed. The SSA5000A automatically switches the scan mode to FFT at 10kHz RBW or lower. In this way the analyzer will stay longer each time it tunes to a certain frequency, and will also analyze all the energy within a frequency spectrum. In this sense, the FFT can be viewed as a parallel array of IF filters operating simultaneously, thus speeding up the sweep speed. Therefore, when analyzing the spectrum of a pulsed signal, the results obtained using an FFT scan mode will be more accurate. The test results are shown in Figure 4–1.
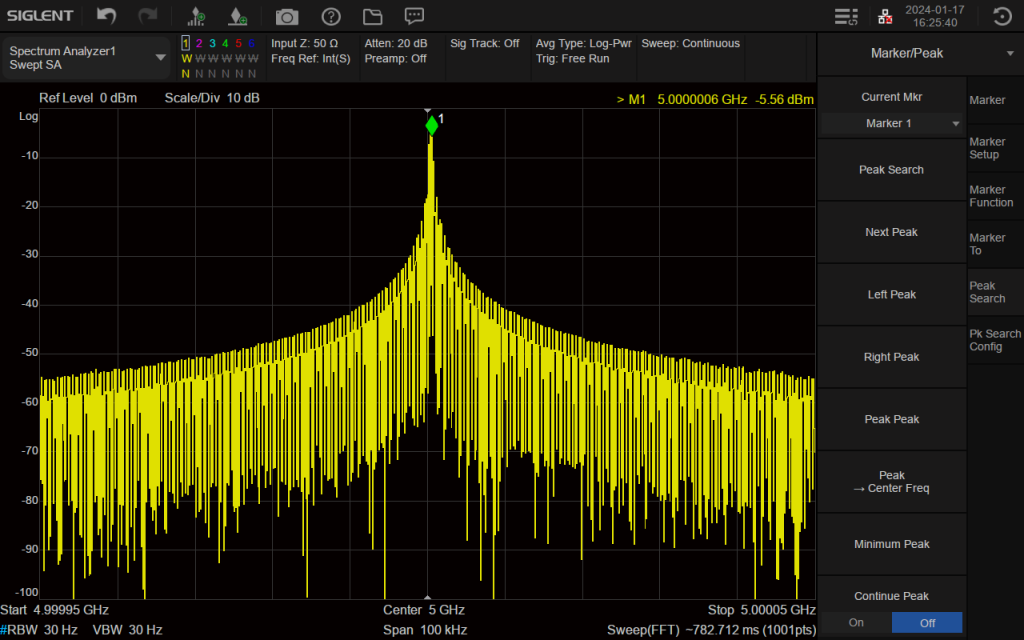
Figure 4–1 Spectrum of pulse modulation in SA mode
4.2 Measure the pulse spectrum using the RTSA
Unlike traditional swept spectrum analyzers, real-time spectrum analyzers do not perform oscillation scanning, but use a broadband ADC to sample signals within a certain bandwidth and perform spectrum calculations with the help of real-time FFT functions of FPGAs. This enables continuous spectrum generation of all ADC sample data without loss, so that no instant signal change is missed. Based on a large number of continuous FFT results, the real-time spectrometer can perform real-time frequency template triggering as well as three-dimensional displays in the time, frequency, and amplitude domains to accurately depict the signal change process. The biggest advantage of real-time spectrum analysis is the uninterrupted measurement of the spectrum and frequency-selective triggering. So, using these two advantages, RTSA is the most scientific tool for complex pulse analysis. The test result of spectrum and spectrogram in real-time spectrum mode are shown in Figure 4–2.
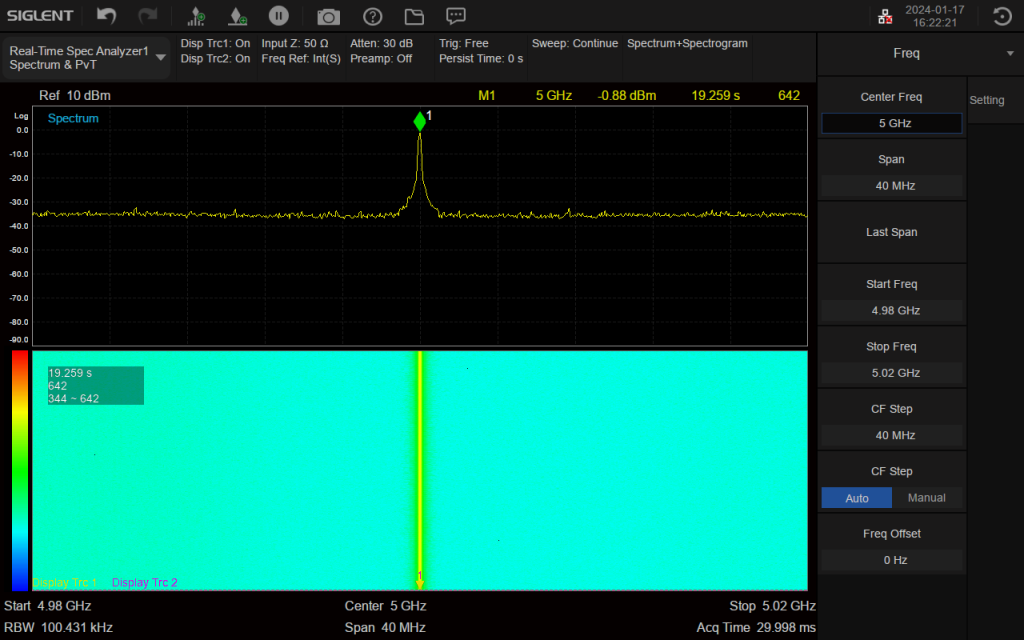
Figure 4–2 test result of spectrum and spectrogram