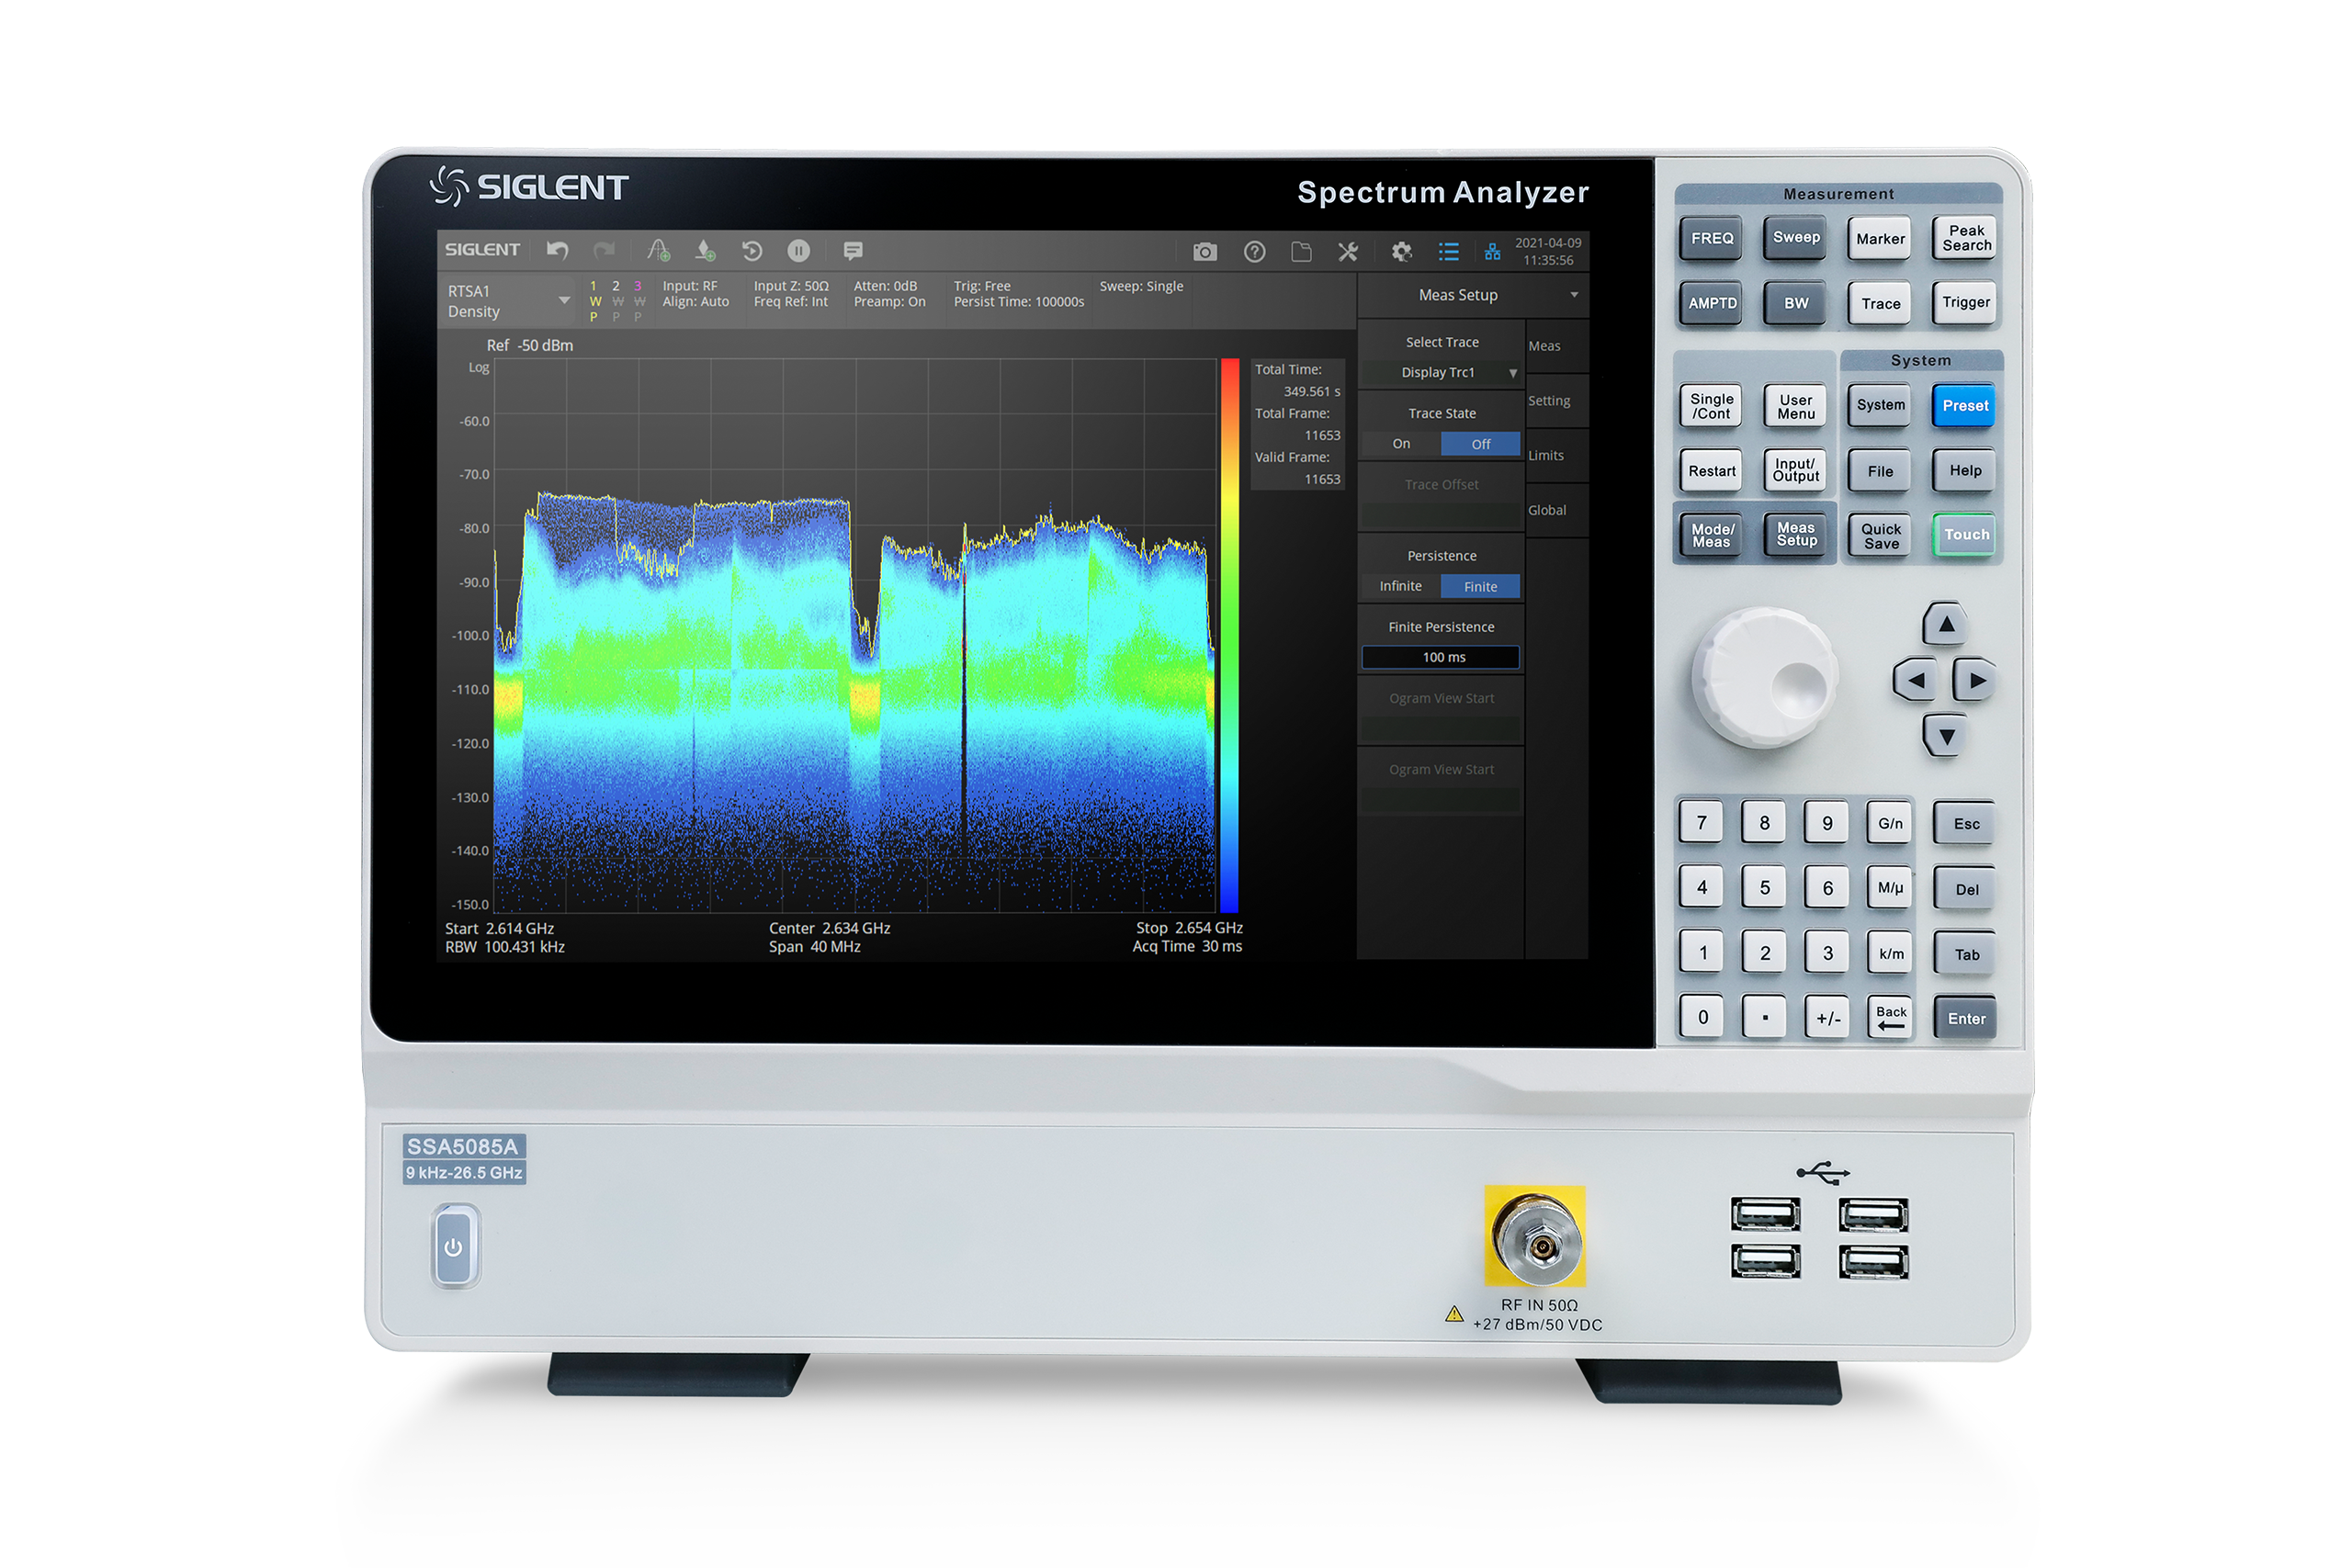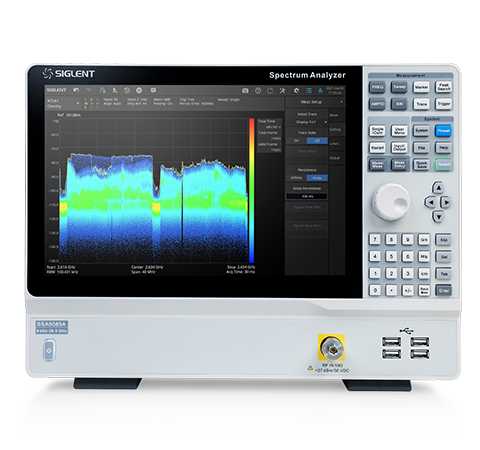
SSA5000A Series Spectrum Analyzer
- Frequency Range from 9 kHz up to 13.6 /26.5 GHz
- -165 dBm/Hz Displayed Average Noise Level (Typ.)
- -105 dBc/Hz@1 GHz,10 kHz offset SSB Phase Noise (Typ.)
- 25 MHz/40 MHz Realtime Spectrum Analysis Bandwidth
- Analog Modulation Analysis and Vector Digital Modulation Analysis
- Channel power, ACPR, OBW, Harmonics, and TOI measurement option
- Web Browser for easy Remote Control over LAN
Product Overview
The SIGLENT SSA5000A spectrum analyzers are powerful and flexible tools for complex RF spectrum and signal analysis. With the capability of real-time spectrum analysis, the analyzer can provide multi-dimensions data displays, and advanced triggering to solve modern RF spectrum challenges, like channel power measurement, hopping frequency, conflict channel, and spectrum interference.
Applications include broadcast monitoring/evaluation, cellular site, IoT, WLAN and Bluetooth surveying, research and development, education, production, and maintenance.
Check out the application note for our latest signal analysis enhancements: Signal Analysis Guide
For a full summary of our RF measurement instruments, view our Spectrum Analyzer Features and Options Tables.
| Frequency Range | Resolution Bandwidth (RBW) | Phase Noise | Total Amplitude Accuracy | Display Average Noise Level (DANL) | Price | ||
|---|---|---|---|---|---|---|---|
| SSA5083A | 9 kHz~13.6 GHz | 1 Hz ~ 10 MHz, in 1-3-10 sequence | <-105 dBc/Hz | <0.5 dB | -165 dBm/Hz | call for quote | Request a Quote |
| SSA5085A | 9 kHz~26.5 GHz | 1 Hz ~ 10 MHz, in 1-3-10 sequence | <-105 dBc/Hz | <0.5 dB | -165 dBm/Hz | call for quote | Request a Quote |
Key Features
- Spectrum Analyzer Frequency Range from 9 kHz up to 13.6 GHz/26.5 GHz
- -165 dBm/Hz Displayed Average Noise Level (Typ.)
- -105 dBc/Hz@1 GHz,10 kHz offset SSB Phase Noise (Typ.)
- 25 MHz/40 MHz Real Tine Spectrum Analysis Bandwidth
- 100% POI 7.20 μs, Dynamic Range 60 dB, Multi-view for Density, Spectrogram, and PvT
- Channel power, ACPR, OBW, Harmonic, TOI measurements and more
- Analog Modulation Analysis and Vector Digital Modulation Analysis
- 12.1-inch Multi-Touch Screen, HDMI output
- Web Browser Remote Control on PC and Mobile Terminals and File Operation
Product Characteristics

Bluetooth Analysis View more
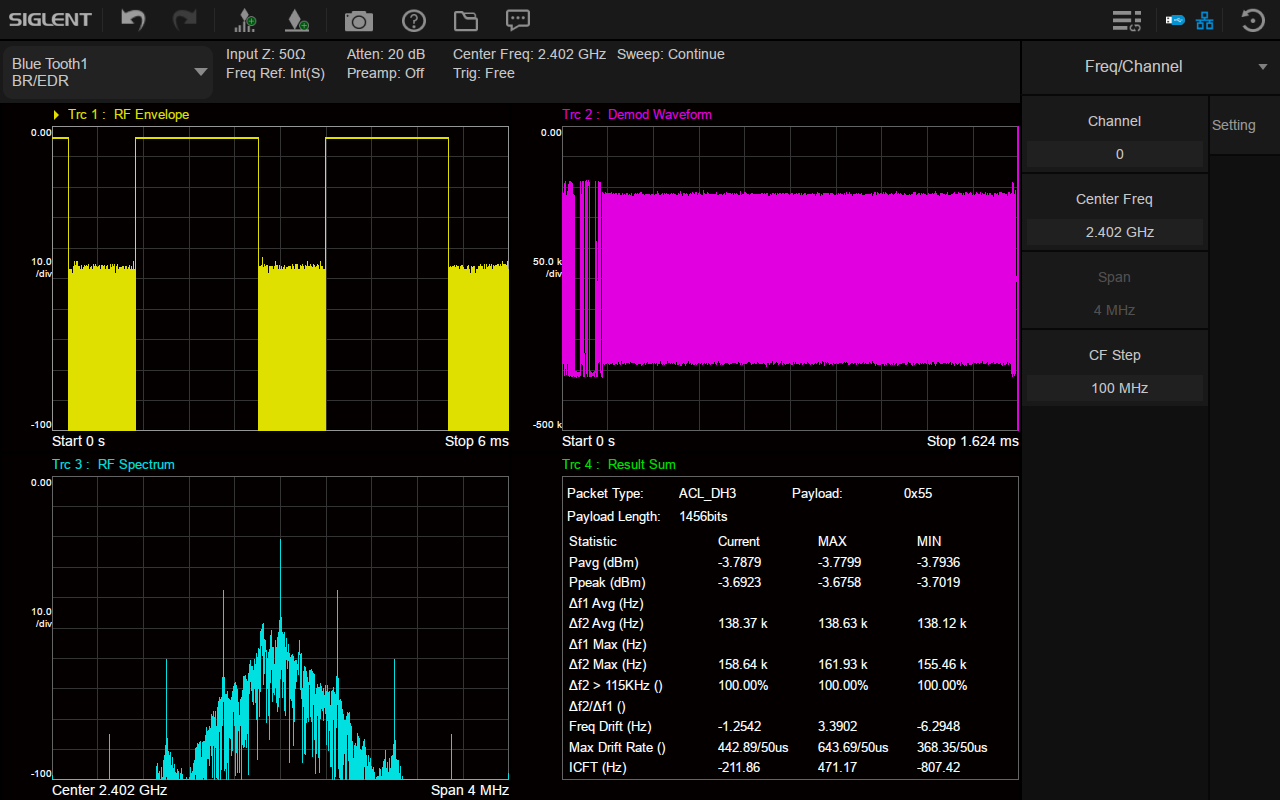
Bluetooth Analysis
Bluetooth is widely used in various devices and application scenarios as a wireless communication technology. The measurement application follows the Bluetooth® RF test specification issued by Bluetooth SIG to calculate the measurement results, and automatically detects the protocol version of the signal for Bluetooth BR/EDR/LE with one-click measurements to help you design, evaluate and manufacture Bluetooth devices with confidence. Together with the new SigIQPro signal generation software and a SSG5000X-V generator, it forms an economical and efficient SIGLENT Bluetooth signal generation and signal analysis solution, accelerating the process from signal generation to data to evaluation. The SSA5000A is helpful for users to troubleshoot flexibly in the laboratory and optimize RF design easily and quickly.
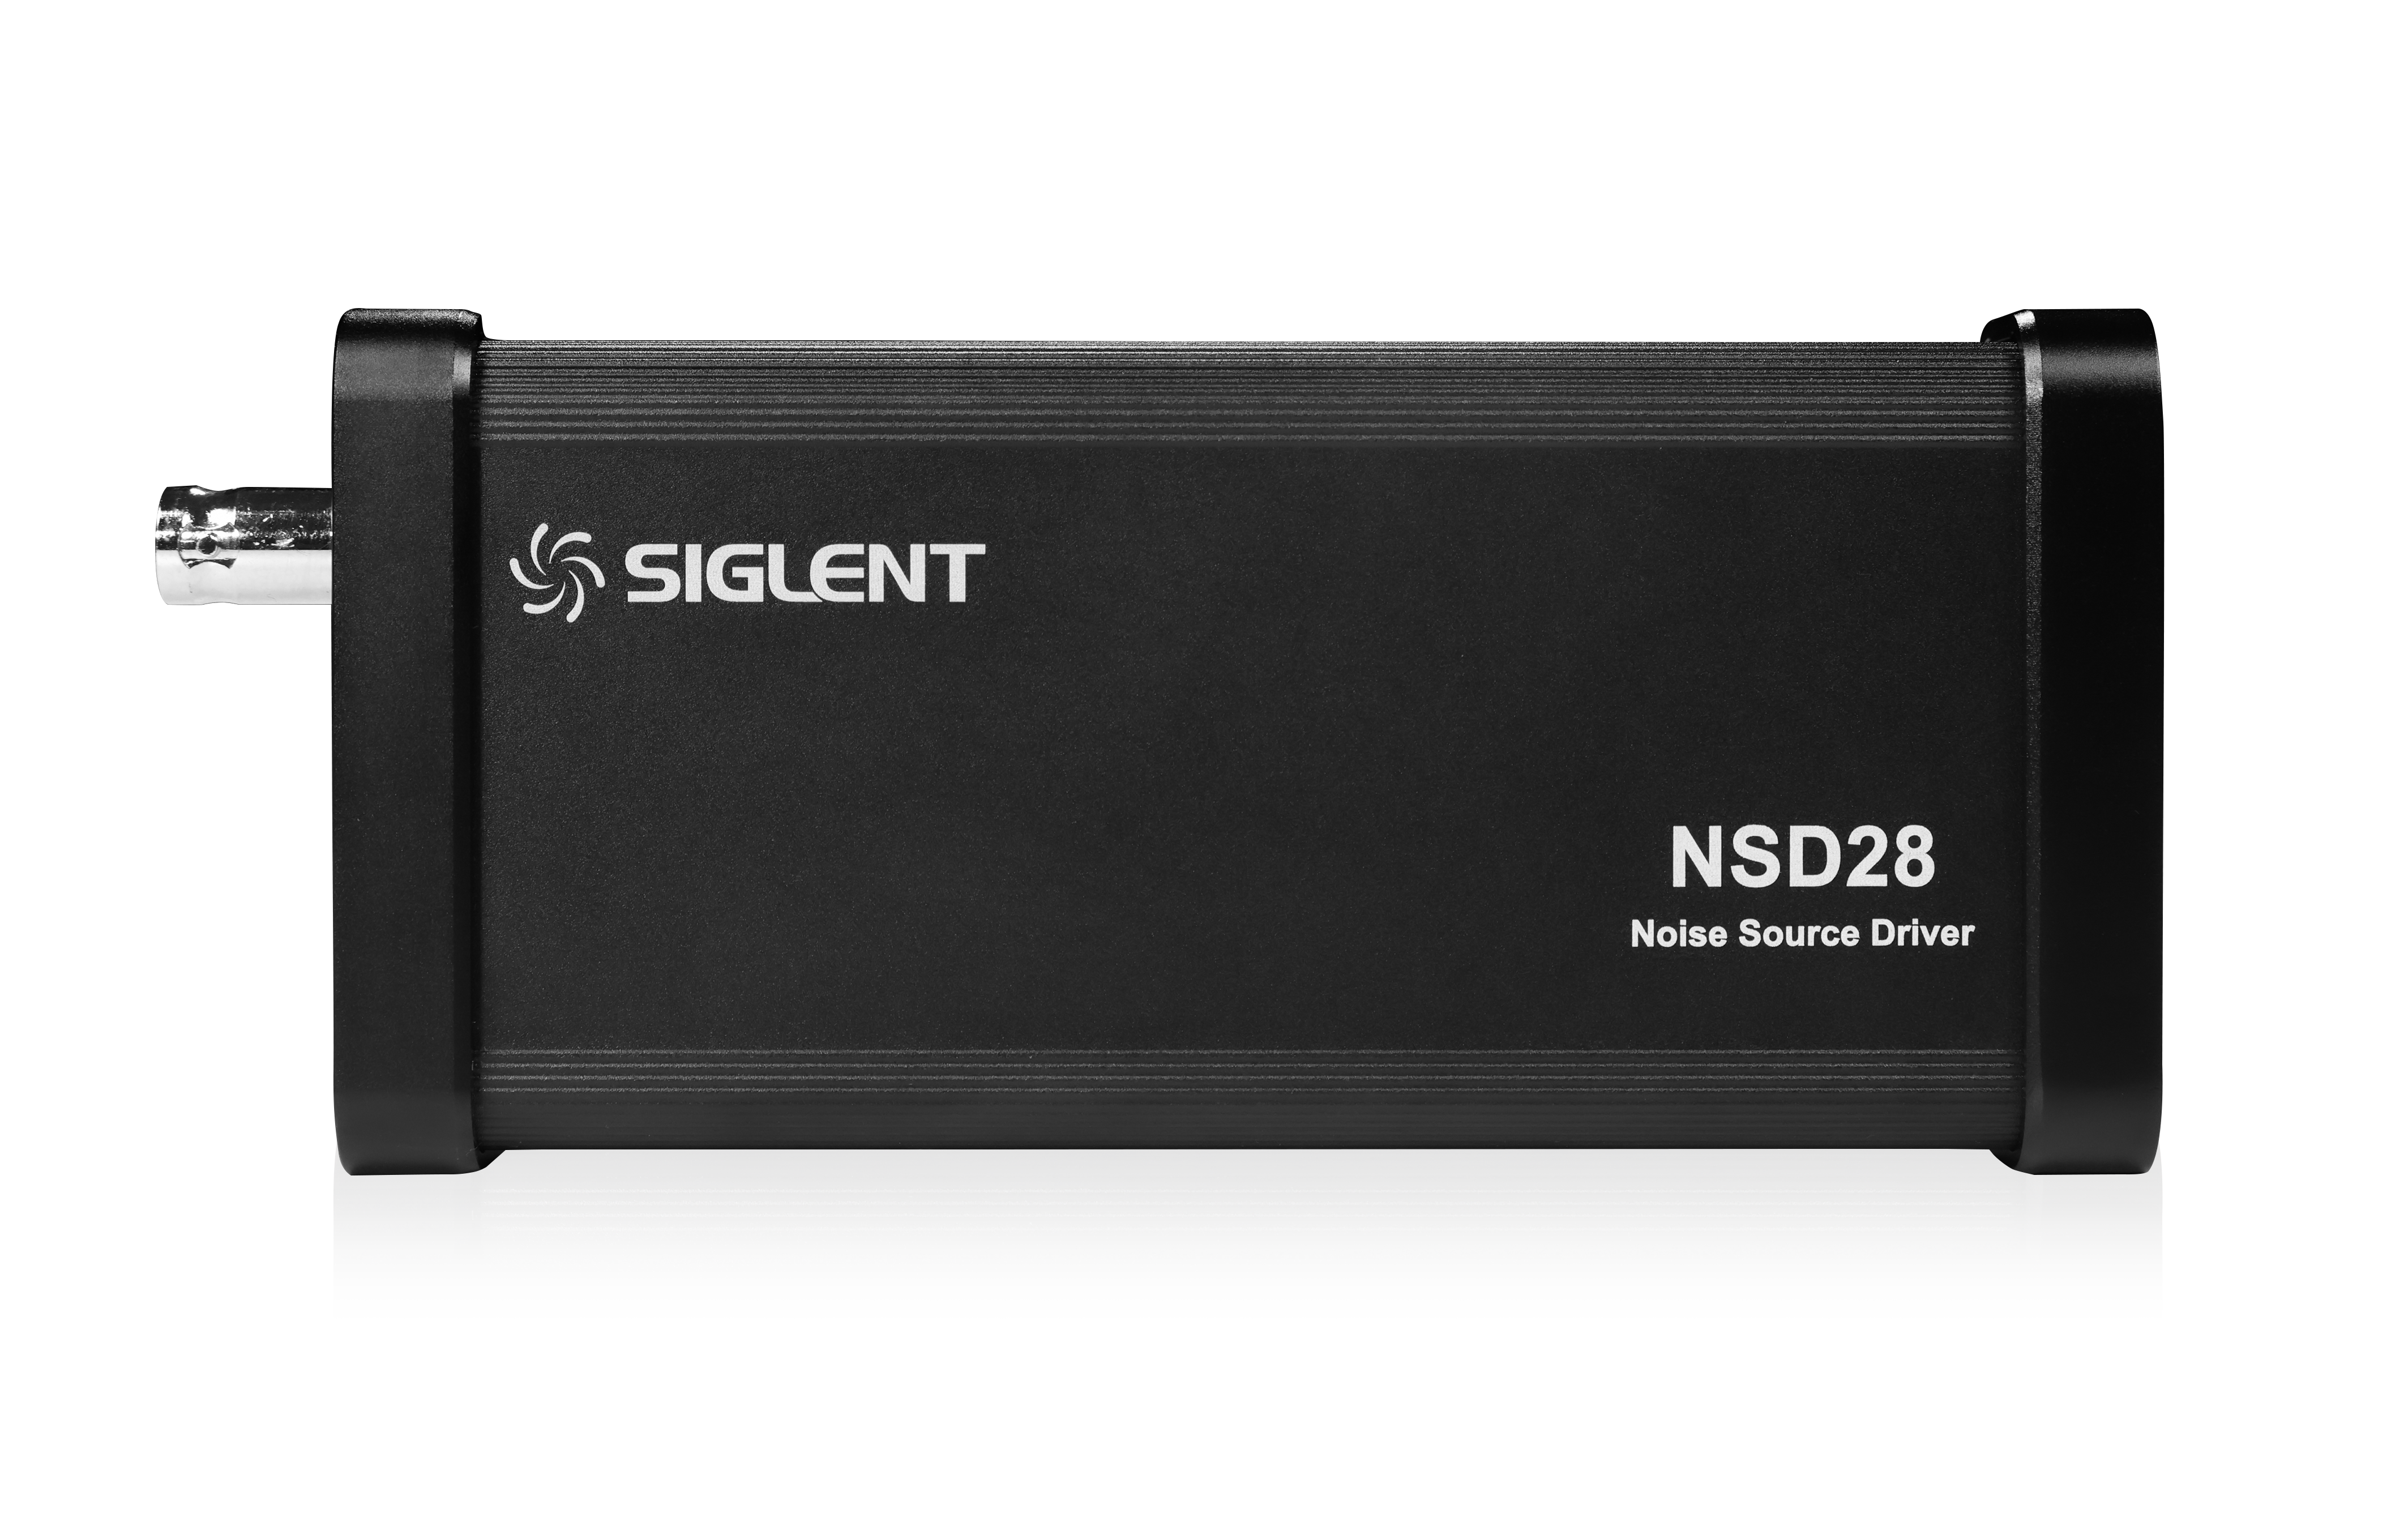
Noise Figure Measurement View more
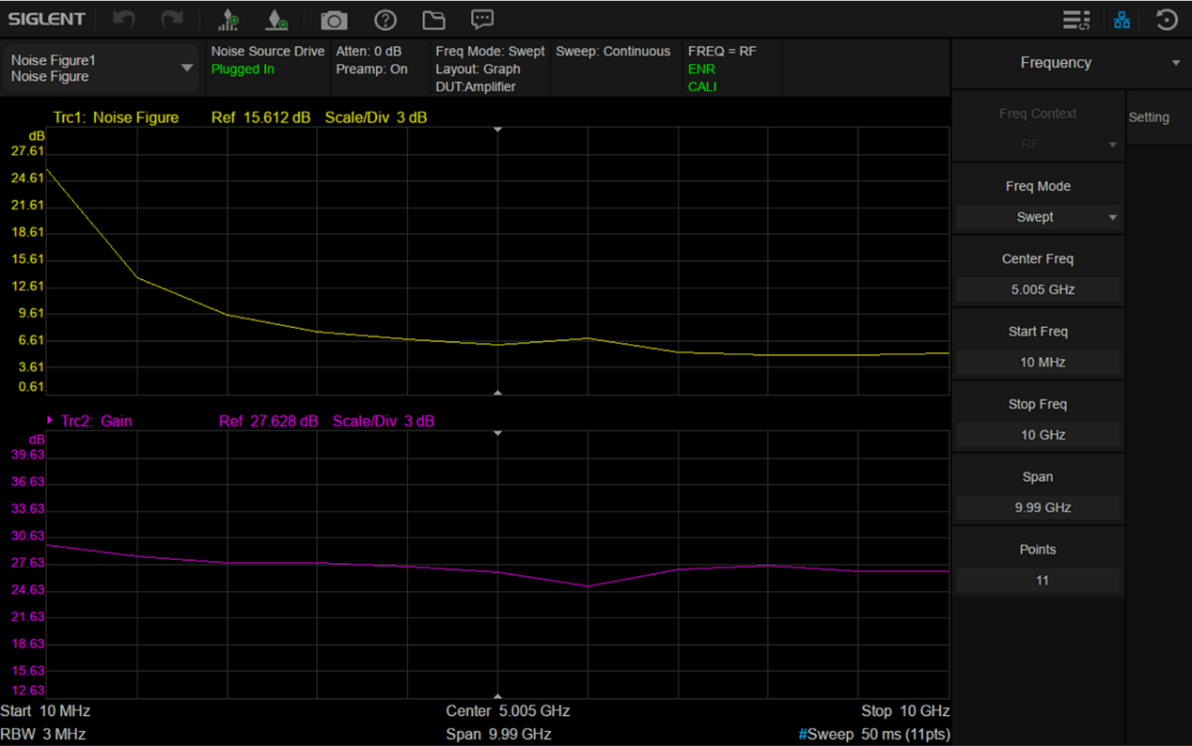
Noise Figure Measurement
Accurate measurement of noise figure is crucial in product development and manufacturing. In the field of research and development, high test accuracy can ensure high repeatability between design simulation and real measurement and help to find the noise sources that are not considered in the simulation process. In the field of production and manufacturing, higher test accuracy means that the index margin can be set smaller when setting and verifying the technical index of the device. The higher the technical index of the final product, the more competitive it will be in the market. Quantifying those unknowns depends on flexible tools that provide accurate, reliable results. The noise figure measurement function of SIGLENT SSA5000A provides engineers with a simple tool, which can quickly and effectively measure the noise figure with high accuracy. Engineers can characterize noise figure and gain of connectorized devices and system blocks with graph, meter, and table layouts, and support the measurement of noise factor, Y-factor, effective temperature, and hot/cold power density.
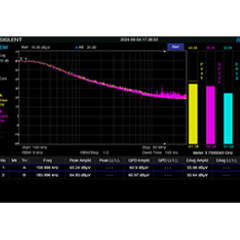
Phase Noise Measurement View more
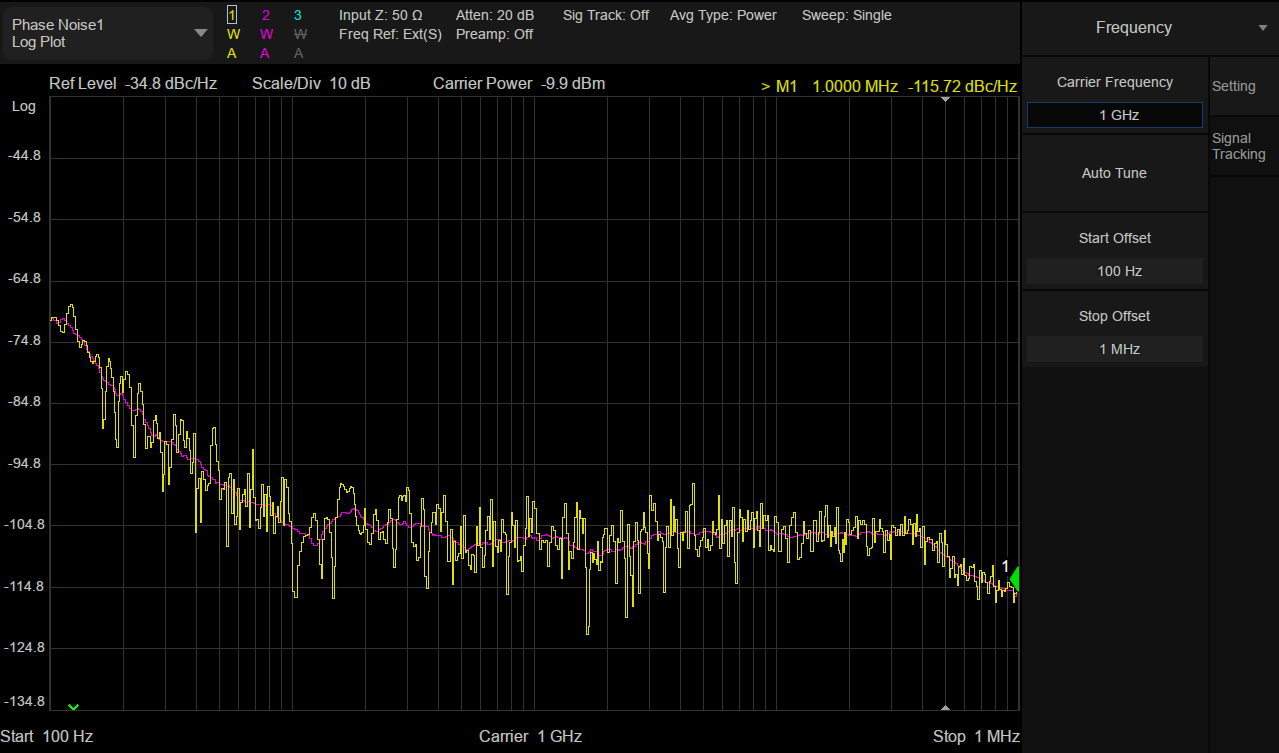
Phase Noise Measurement
A stable frequency source is a common need for many electronic devices and most RF equipment. Phase noise can be used to characterize the short-term frequency stability of these frequency sources. Siglent’s SSA5000A Spectrum analyzers now provide a one-button phase noise measurement. The SSA5000A features lower Display Average Noise Level (DANL) and phase noise ensuring the accuracy of your tests. The smaller resolution bandwidth avoids measuring both carrier power and noise power together, and the measurement results are automatically calculated and graphed. The use of a logarithmic scale for the horizontal coordinate gives both a wider frequency range and finer resolution when close to the carrier – smaller offsets tend to reflect the quality of the signal better than phase noise at larger frequency offsets.
Pulse Measurement View more
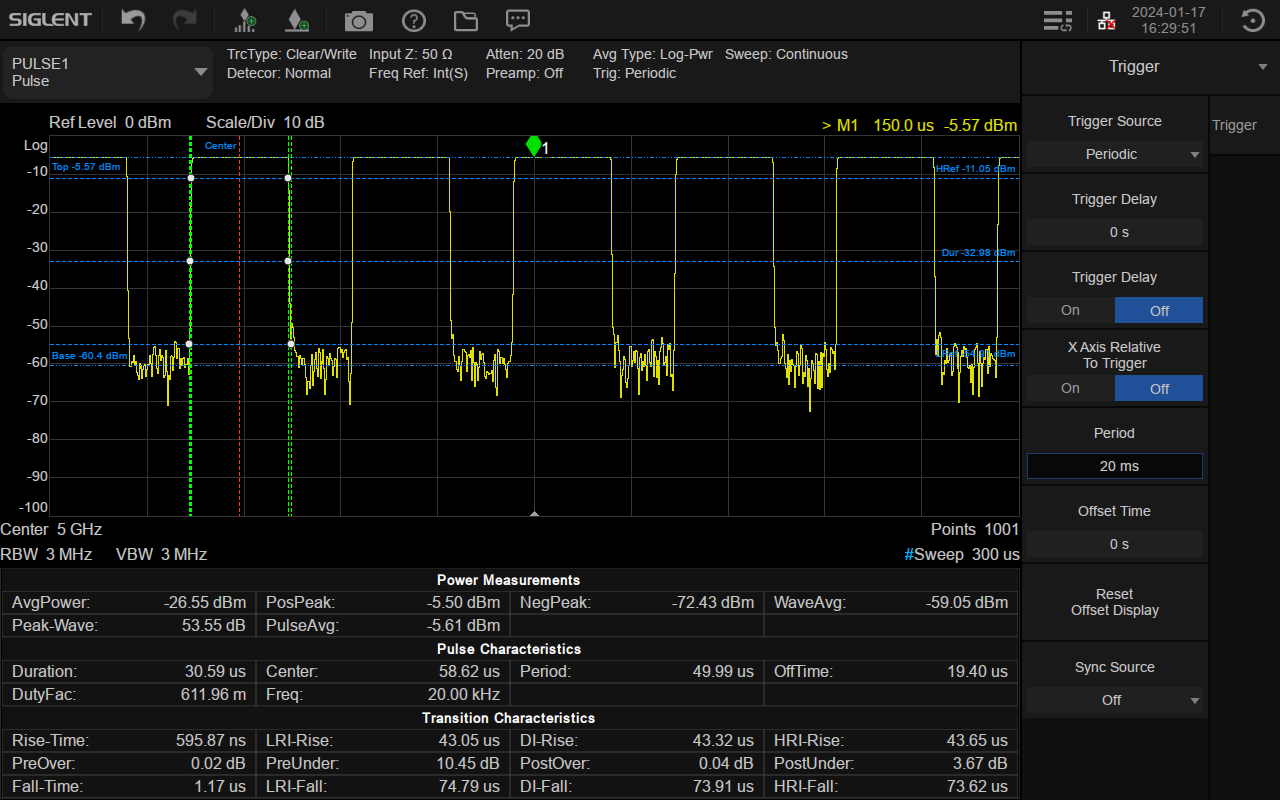
Pulse Measurement
RF pulse signals are widely used in pulse modulation, and for engineers working in related fields, it is challenging to accurately verify RF pulse signals. In some pulse applications, signal design and verification require integrated time domain/frequency domain/modulation test tools for pulse signal analysis. Siglent’s SSA5000A Pulse Measurement option can help engineers better analyze today’s dynamic signal environments with automatic power level, pulse characteristic, and conversion characteristic measurements. With high resolution bandwidth up to 10MHz the rise time measurement result can be as low as 66ns, making accurate measurements on a wide range of pulse types with a variety of triggering methods to cleanly capture the pulse shape.
Spectrum Analyzer Mode View more
Spectrum Analyzer Mode
Various RF spectrum measurement and analysis views
Real Time Analysis Mode View more
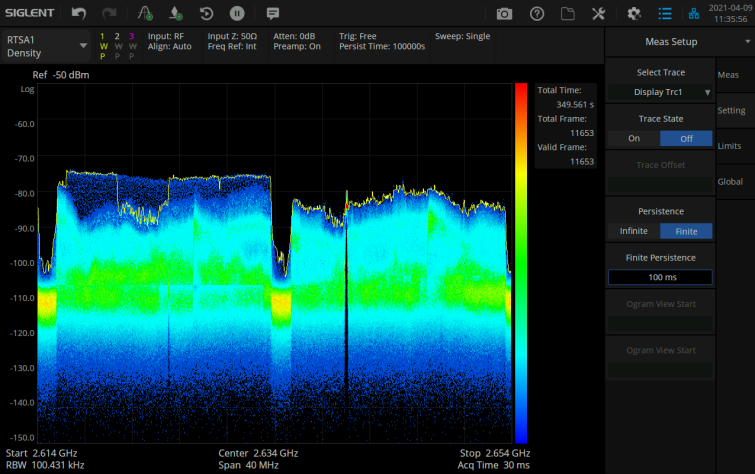
Real Time Analysis Mode
25 MHZ/40 MHz real-time spectrum analysis with multi-view to monitor complex signals
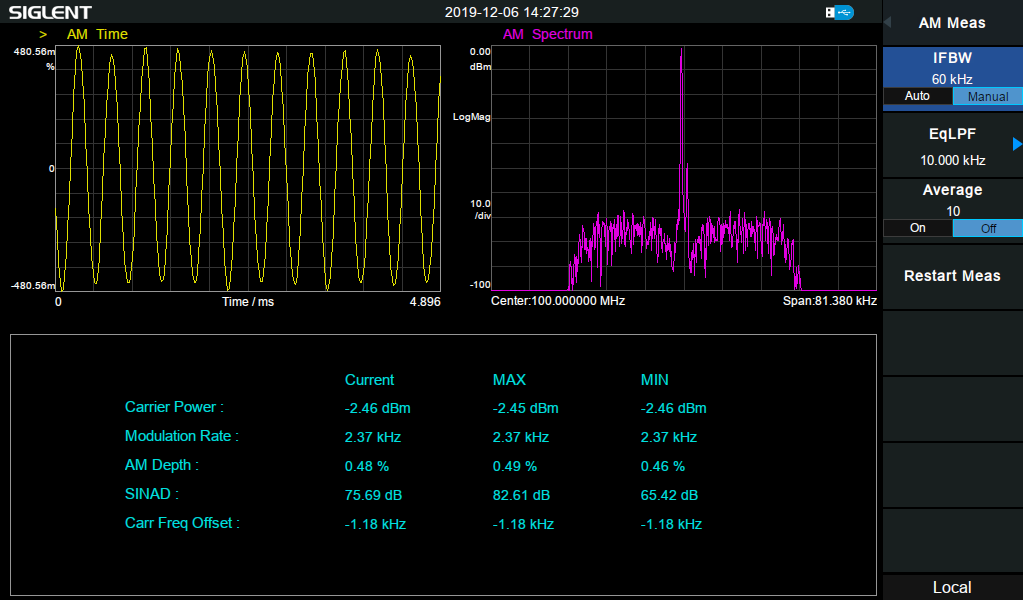
Modulation Analysis Mode View more
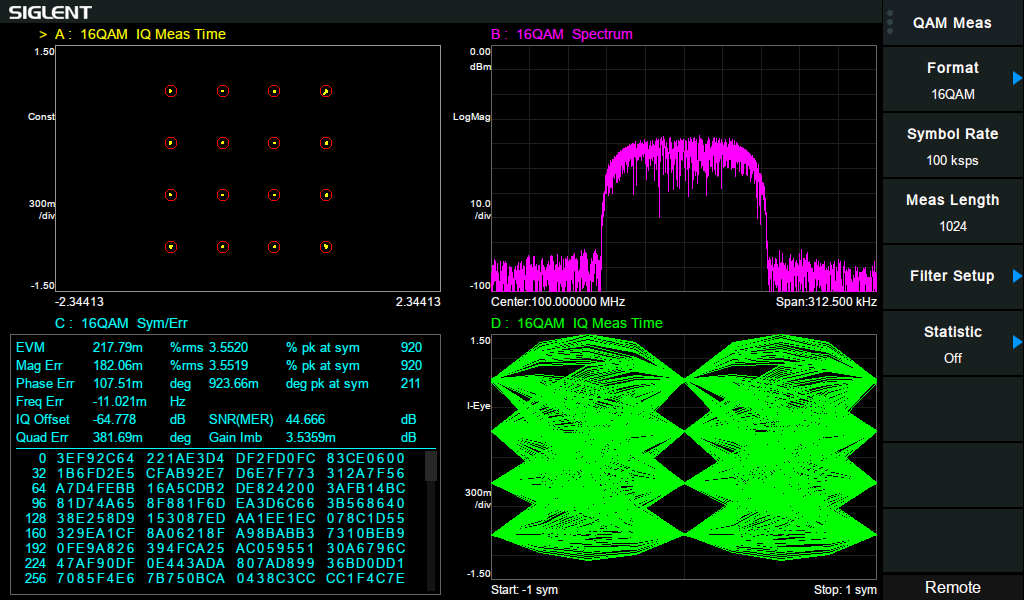
Modulation Analysis Mode
AM/FM/PM analog modulation, and ASK/FSK/PSK/MSK/QAM vector modulation analysis
Standard Accessories
USB Cable
Wireless Mouse
Quick Start-SSA5000A
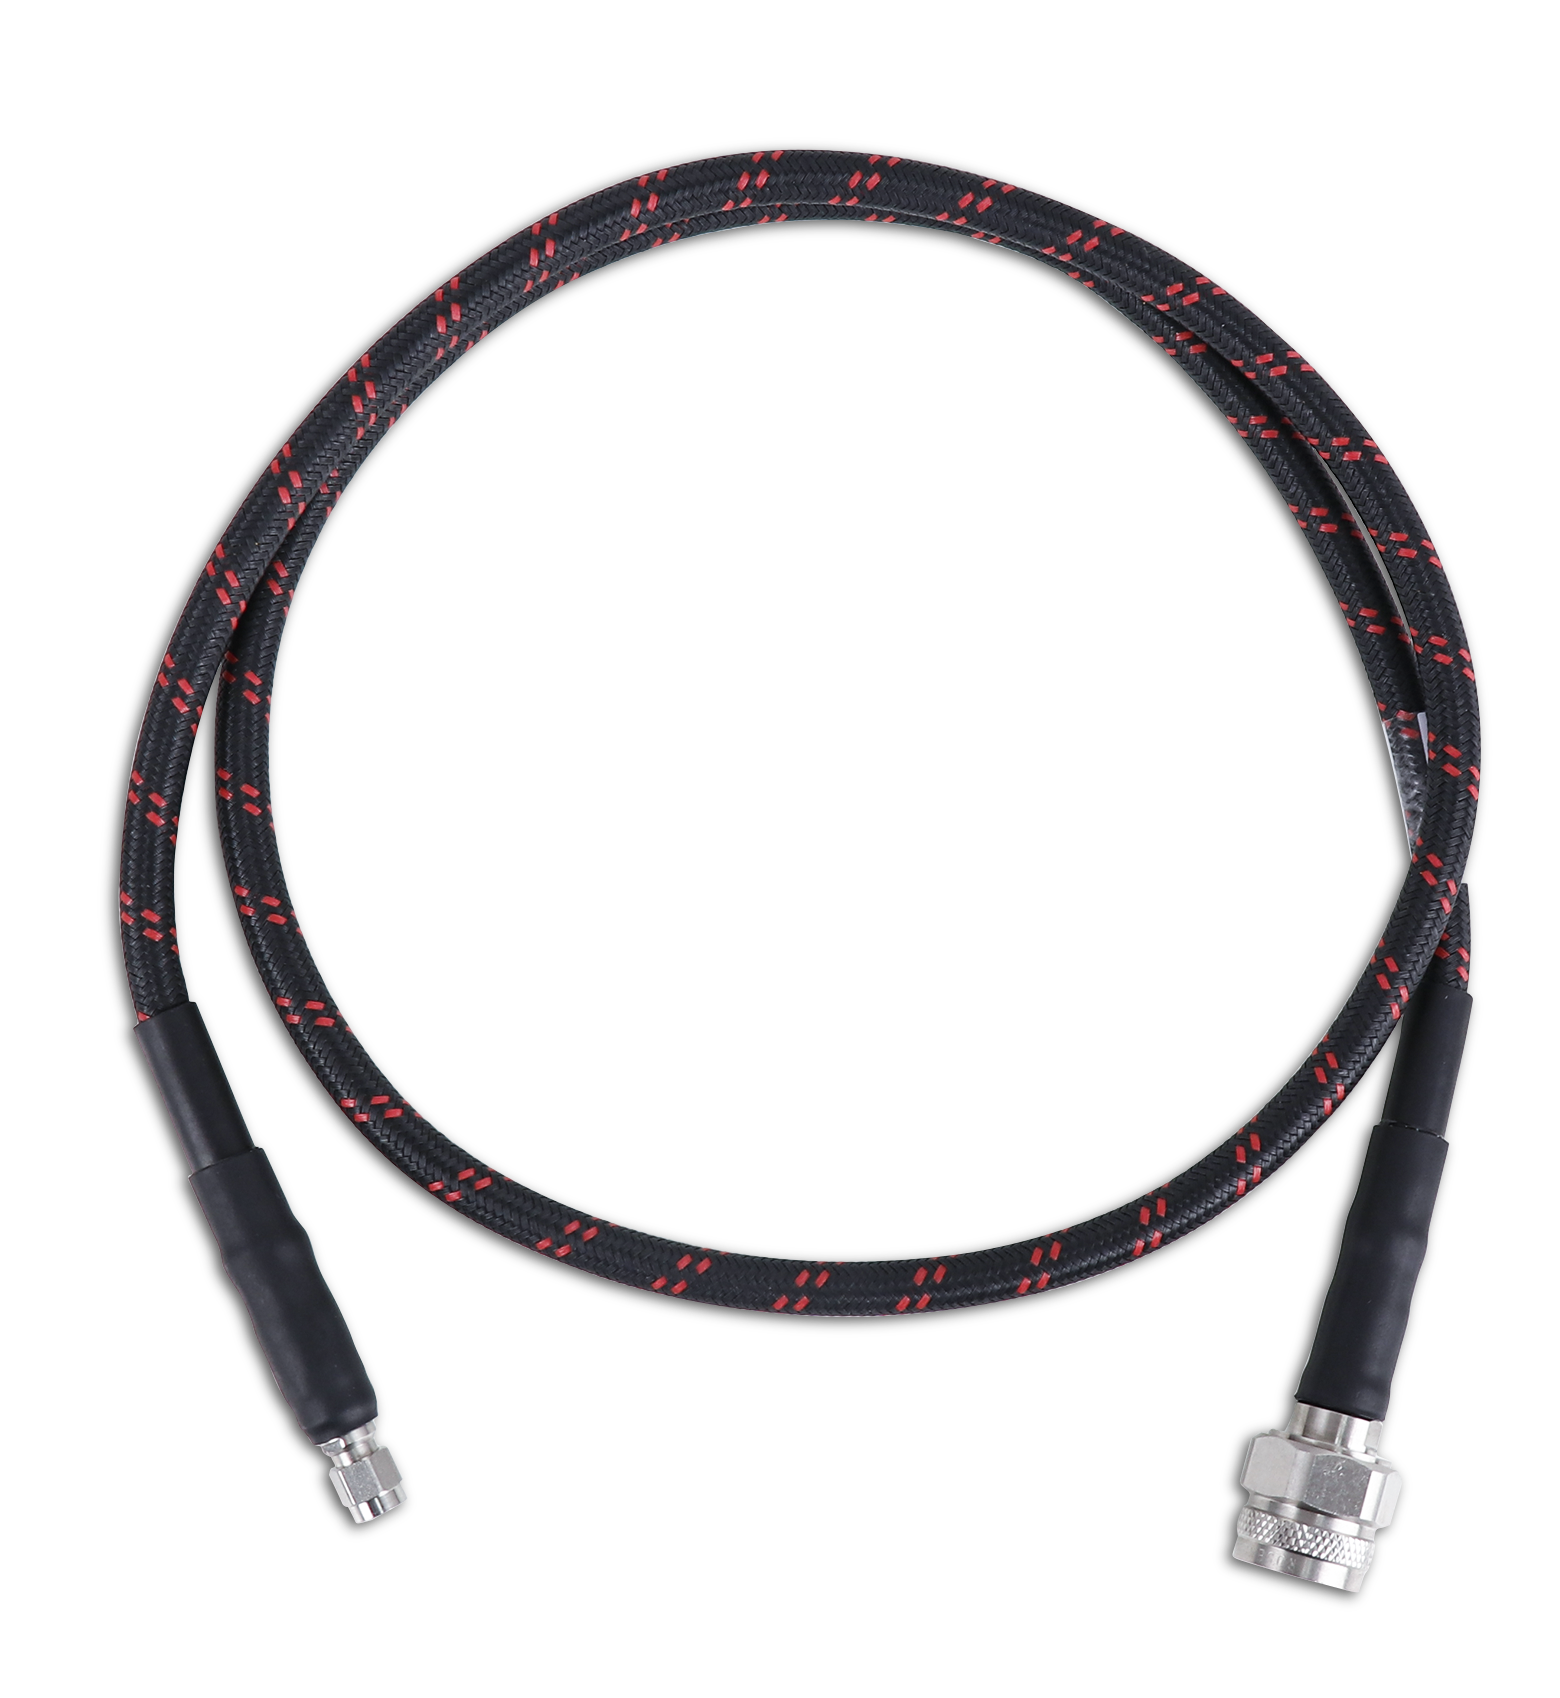
2.92 mm Female to Female Adapter (2.92F-2.92F-40A)