Using the SSA5000A noise figure measurement option
February 3, 2024
1 Introduction
The article demonstrates how to use the noise figure analysis function of SIGLENT SSA5000A spectrum analyzer to make high quality noise figure measurements quickly and efficiently.
1.1 Noise Figure Fundamentals
1.1.1 Definition of Noise Figure
Noise is the interference generated inside components or systems, which leads to the deterioration of circuit performance; There are three main parameters for noise quantization: noise figure (NF), noise factor (F) and equivalent noise temperature (Te).
The noise factor (F) is defined as the ratio of the signal-to-noise power ratio at the input to the signal-to-noise power ratio at the output.
Noise Factor: F= (Sin/Nin)/(Sout/Nout)
Where Sin = input signal power; Sout = output signal power; Nin = input noise power; Nout = output noise power.
To express the noise factor in decibels (dB) is the noise figure (NF): NF (dB) = 10*log (F).
Most LNAs are described by noise figure, but Te is commonly used to characterize the noise of an LNA when the noise factor is less than 1 dB: Te = 290*(F-1). The equation expresses the relationship between noise figure and temperature: NF (dB) = 10*lg (1+ Te /290)
1.1.2 Noise Figure Measurement Method
There are two main methods to measure noise figure: Y factor method and cold source method. In this paper, we discuss the Y factor method.
The noise source is an essential equipment for the Y-factor method of measurement. The noise source is a noise generator that can generate two different noise powers. Usually, it needs a DC pulse power supply drive voltage. When the DC drive voltage is supplied, it is equivalent to the noise source being on, which is called hot state. At this time, a large noise power is output. When the power supply is turned off, it is equivalent to the noise source off, which is called cold state. At this time, the noise power at room temperature is output. For a given noise source, the value of ENR will change with frequency. According to the different internal attenuators, the nominal value of ENR of typical noise sources ranges from 6 dB to 15 dB. Using the noise source, two noise power measurement results can be obtained at the output port of the device under test. The ratio of these two measurement results (called Y factor) can be used to calculate the noise figure: NF=ENR-10lg(Y-1), and ENR is generally given by the specifications of the noise source.
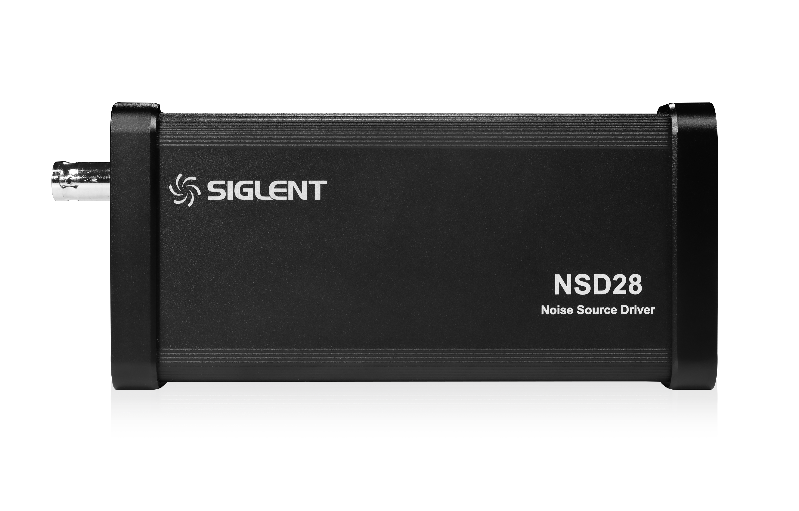
Figure 1‑1 NSD28
1.2 Amplifier Measurement
In this section, a low noise amplifier with a frequency range of DC-10 GHz is used as an example to demonstrate how to use the noise figure analysis function of SSA5000A to measure the noise figure quickly and effectively.
Table 1‑1 DUT Specifications
| Frequency Range | Gain | Noise Figure |
| DC-10 GHz | 26 dB | 6 dB |
1.2.1 Calibration Step
In order to accurately measure the noise figure, before measuring the DUT, the measurement system must be calibrated to identify and correct the inherent noise figure of the system, and the measured instrument noise figure is removed from the total noise figure measurement value, so that only the noise figure and gain of the DUT are displayed.
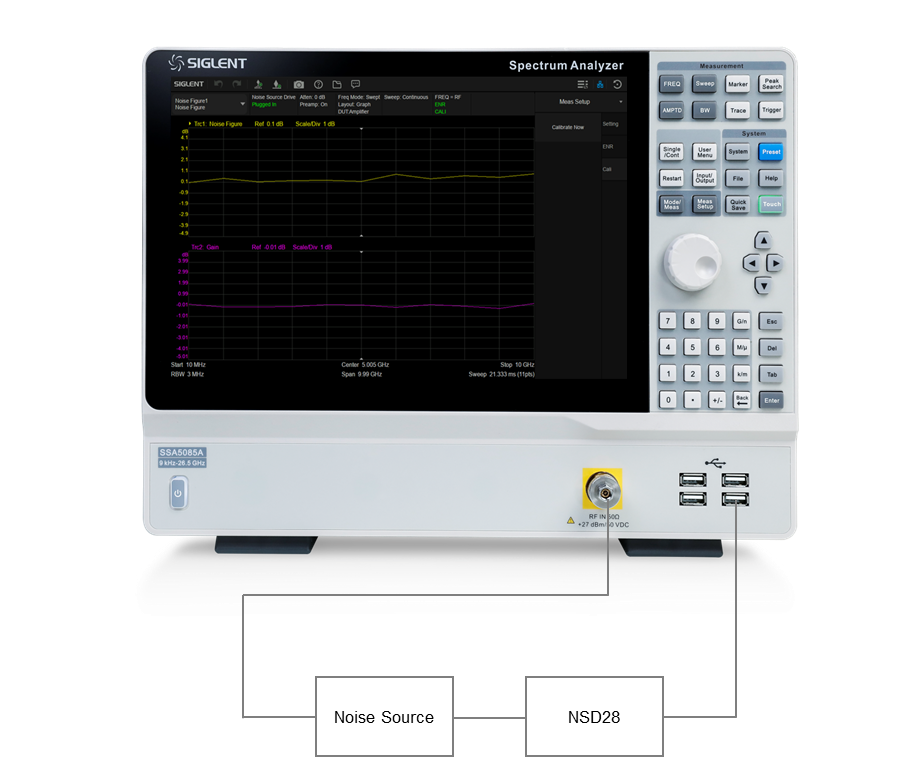
Figure 1‑2 Connection setting of noise figure measurement calibration
Operating procedure:
1. After 30 minutes of warm-up, click Spectrum Analyzer in the upper left corner to enter the window management page, and click Noise Figure (NF) > Noise Figure to add noise figure analysis window. At this time, the SSA5000A works in the noise figure measurement mode.
2. Connect the noise source: Connect the noise source and the spectrum analyzer according to the calibration settings in Figure 1-2. The analyzer controls the noise source through USB connection and directly connects the output of the noise source to the RF signal input end of the analyzer.
3. Setting amplitude: Select AMPTD. When entering the noise figure mode, the internal preamplifier will be turned on automatically, and the input attenuation value will be fixed at 0 in the automatic mode.
4. Setting frequency: Select FREQ, set the start frequency to 10 MHz, the stop frequency to 10 GHz and the number of scanning points to 11.
5. Setting ENR: Select Meas Setup > ENR > Edit ENR and fill it in the ENR table, which is a series of frequencies and ENR values corresponding to frequencies.
6. Save the ENR table: Select Meas Setup > ENR > Save and save the filled ENR value and display to verify the data has been transmitted correctly.
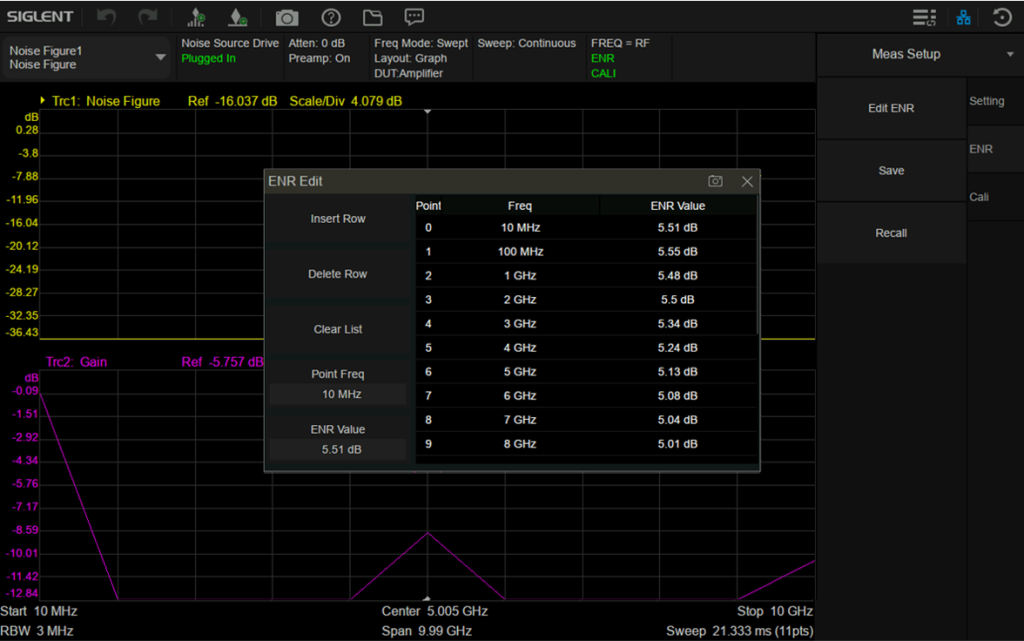
Figure 1‑3 ENR table
7. Set average: Select Meas Setup > Setting, the average number of times is 10 and switch to on.
8. Perform calibration: Select Meas Setup > Cail > Calibrate now > Enter.
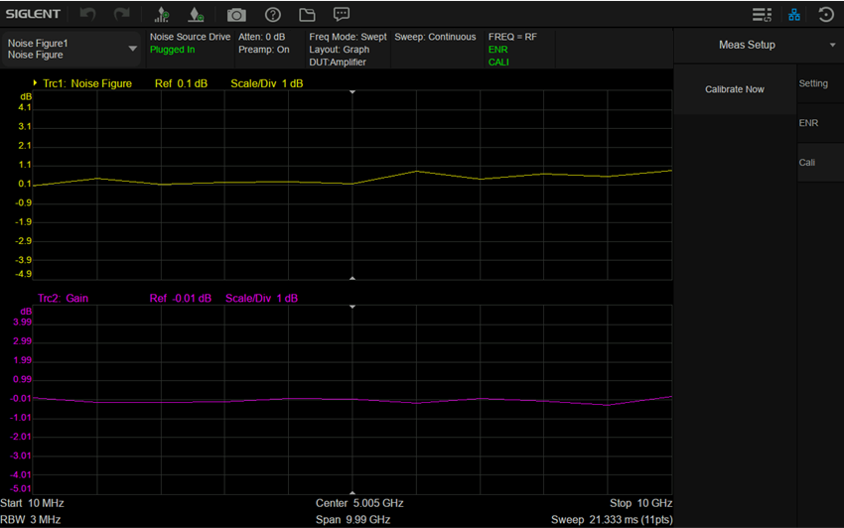
Figure 1‑4 Noise figure measurement calibration
9. View the results in the table: Select Trace > Format > Layout > Table. When the calibration is completed and the device under test is not inserted, the gain and noise figure are close to 0 dB, which indicates that the analyzer has removed the noise components from the measurement system, and the results can be better viewed by using the table layout mode.
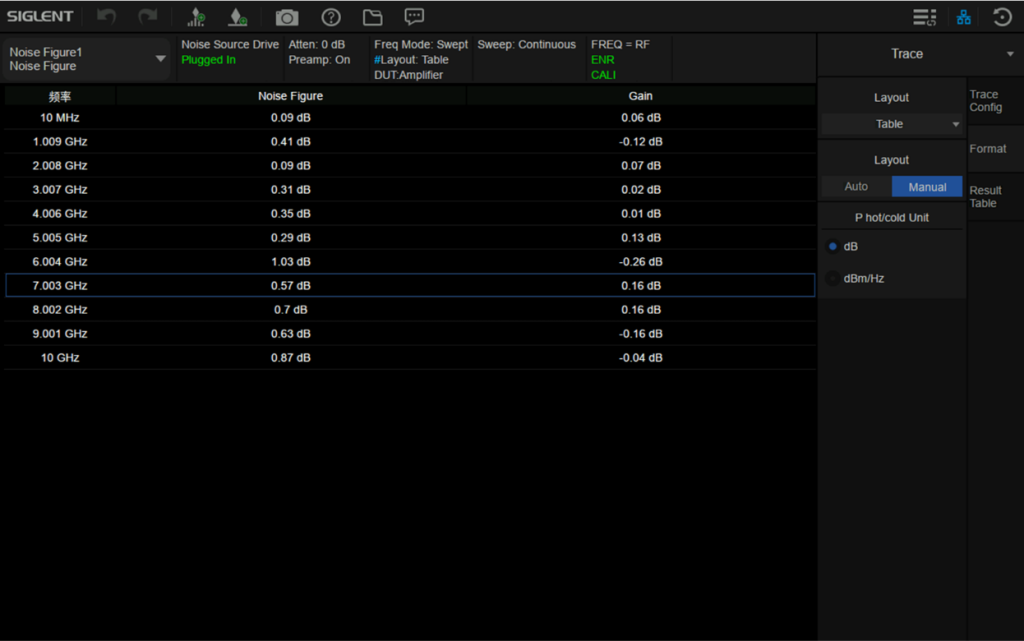
Figure 1‑5 Noise figure measurement calibration
1.2.2 Measurement Step
After the calibration is completed, maintain the control of the analyzer on the noise source, connect the output of the noise source to the input of the DUT, and connect the output of the DUT to the RF signal input port of the analyzer.
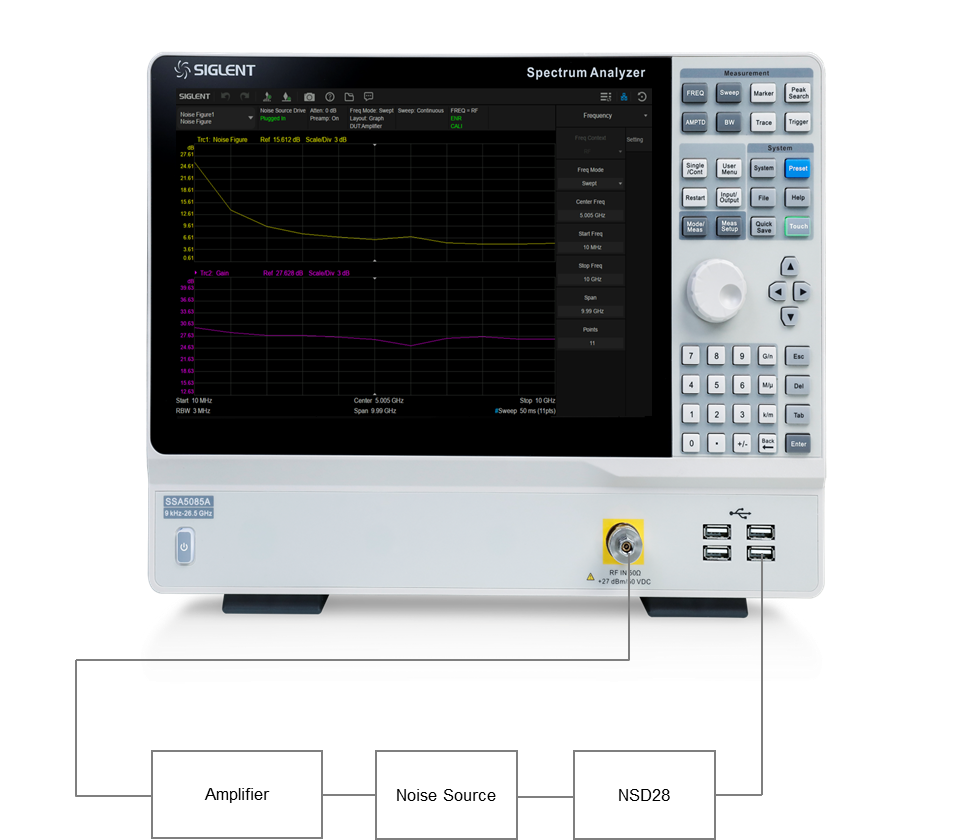
Figure 1‑6 Connection settings for noise figure measurement
After connecting the DUT and the noise source, the measurement results appear on the display screen of the analyzer. The results show that the noise figure of DUT is 6.12 dB and the gain is 26.69 dB. Therefore, the device under test meets the manufacturer’s specifications in the target frequency range.
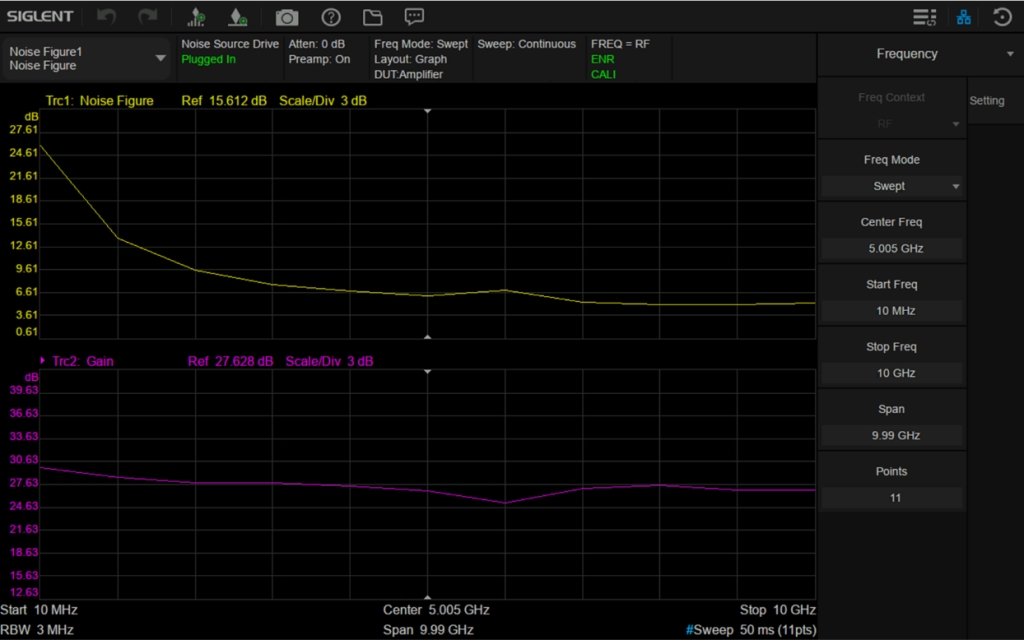
Figure 1‑7 Noise figure measurement result
1.2.3 Gain Measurement Method
We use the gain method to make a simple check on the measurement results. The accuracy of this method is lower than that of the Y-factor method which needs to be calibrated by the noise source, and it is equivalent to the amplitude accuracy of the analyzer.
DANL reflects the minimum level that the analyzer can measure, and also reflects the level of internal noise of the analyzer. Connect a 50Ω matching load to the input of the analyzer or directly suspend the input interface, and the measured DANL is -161.92 dBm/Hz. Then, the output of the amplifier is connected to the input of the analyzer, and the input of the amplifier is connected to a 50Ω matching load or directly suspended. The noise power spectral density measured without power supply is -161.97 dBm/Hz, and the noise power spectral density measured with power supply is -142.05 dBm/Hz.
Operating procedure:
1. Select FREQ, set the center frequency to 5 GHz and the Span to 10 MHz.
2. Select AMPTD, set the attenuation to 0 dB, and turn on the preamp.
3. Select BW and set the resolution bandwidth to 3 MHz.
4. Select Trace and set the average trace type.
5. Select Marker > Marker Function and set the Noise Marker.
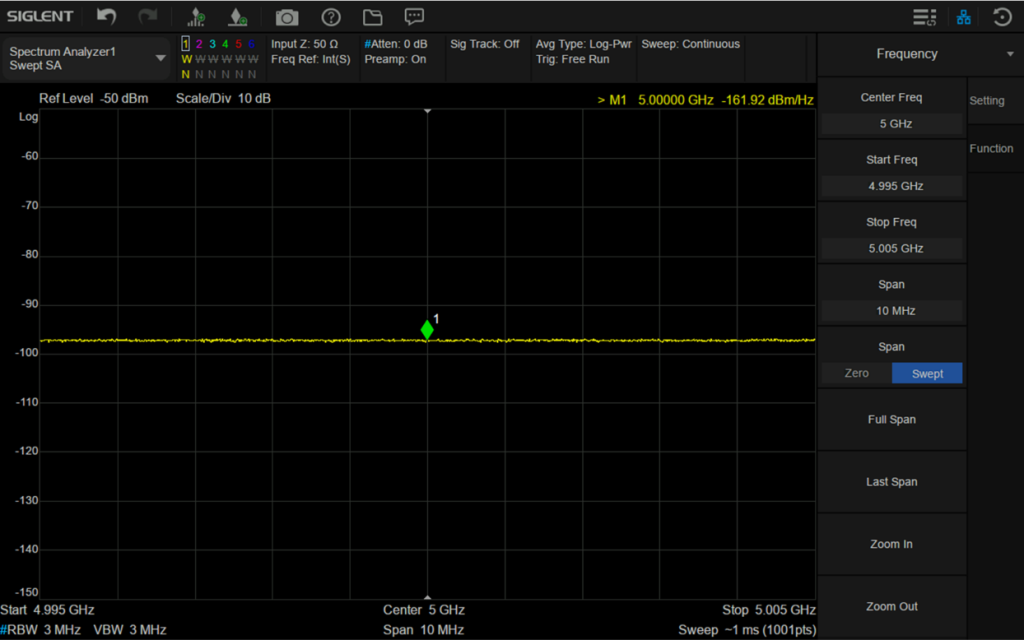
Figure 1‑8 Noise power spectral density of analyzer
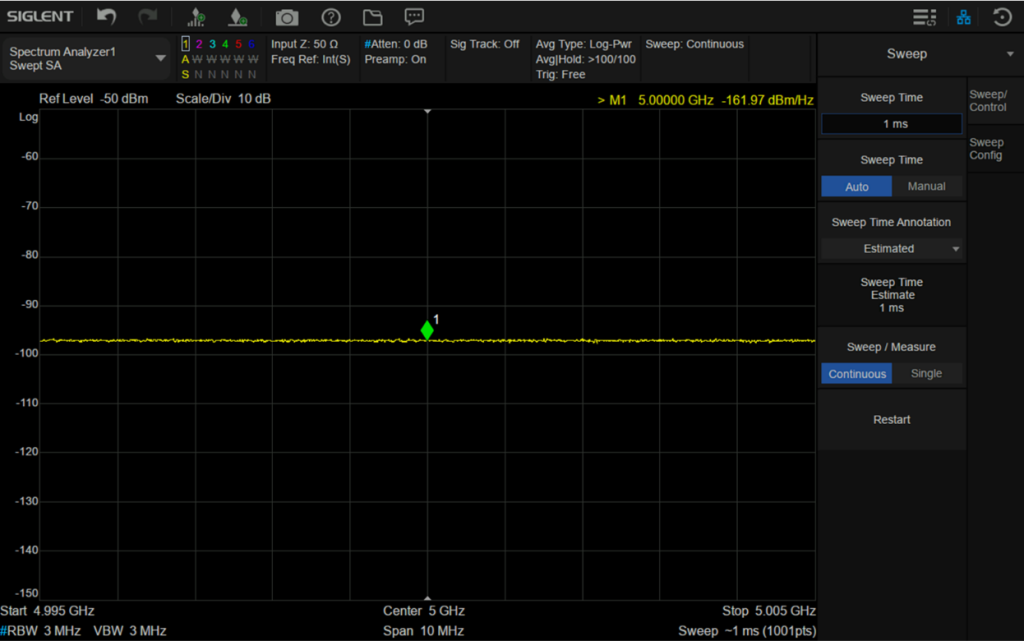
Figure 1‑9 Noise power spectral density of unconnected power supply
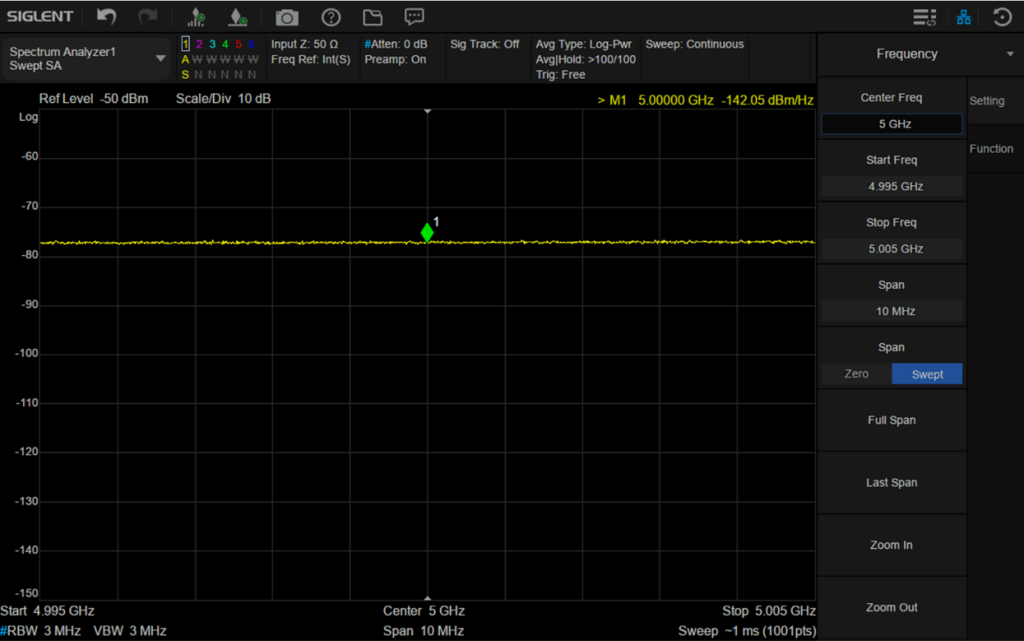
Figure 1‑10 Noise power spectral density of connected to power supply
The logarithmic form of noise figure is:
NF(dB)=10lgF=10lg P_out/(GkT_0 B)=10lgP_out-10lgG-10lgB-10lgkT_0
=P_out (( dBm)⁄Hz)+174(( dBm)⁄Hz)-Gain(dB)=-142+174-26=6
Therefore, the gain measurement method needs to obtain the gain of the DUT and the noise power spectral density of its output when the physical temperature of the input terminal of the DUT is 290K. The thermal noise at room temperature is -174 dBm/Hz (the theoretical minimum value of DANL at room temperature), and the power spectral density can be measured by the analyzer. The biggest limitation of the measurement comes from the noise floor of the analyzer. Because the P_out (( dBm)⁄Hz) of a DUT with low gain and low noise figure is very small, which is often far less than the noise floor of analyzer, the gain measurement method is only suitable for a DUT with high gain and high noise figure.