Measuring Filter Characteristics Using the SSA3000X Plus / SSA3000X-R / SVA1000X Spectrum Analyzer
June 22, 2021
A filter is a universal, two-port, frequency-selective device used in a wide variety of electronic circuits and applications. A low-pass filter is one that passes signals with a frequency lower than a certain cut-off frequency while attenuating the higher frequencies. Low-pass filters are often used in radio transmitters, audio devices, and communication systems. They can be viewed as a two-port network when using a spectrum analyzer to characterize. The following steps are used to measure the low-pass filter characteristics using the Siglent SSA3000X Plus, SSA3000X-R, or SVA1000X series of spectrum analyzers.
In this example, the SVA1000X spectrum analyzer will be used to characterize a 50 MHz low-pass filter.
Step 1: Normalize
In order to ensure accurate measurement results of the amplitude-frequency characteristics of the filter and avoid being affected by the frequency-related responses associated with the connecting cables, the instrument and cables first need to be normalized.
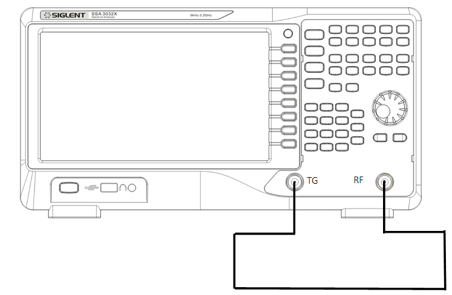
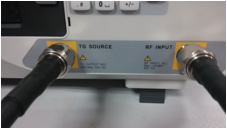
1. Connect the instrument and cables as shown below.
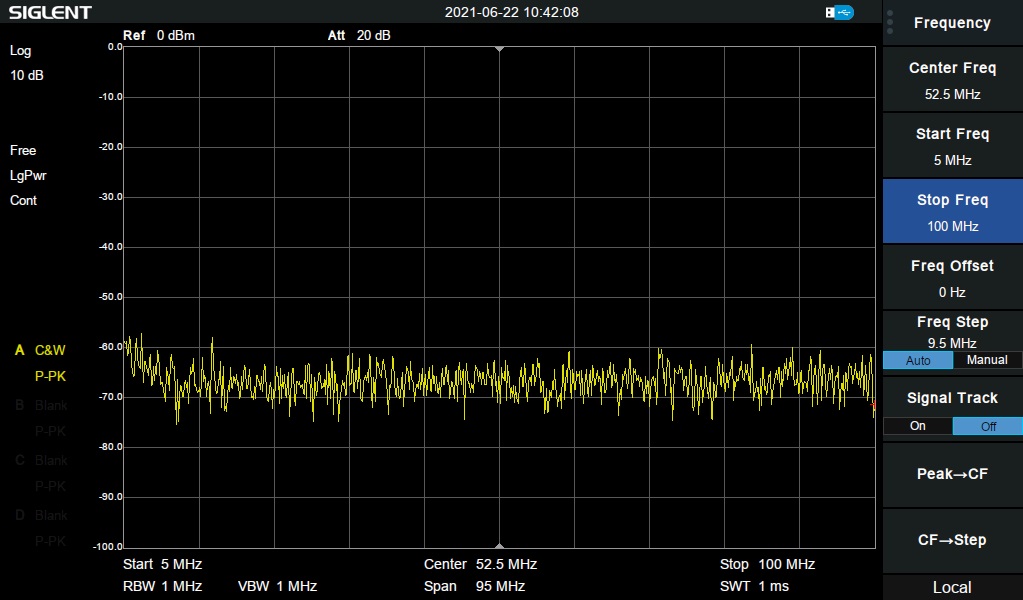
2. Set the start frequency, stop frequency, resolution bandwidth:
a) Press Frequency-> Start Freq-> 5 MHz;
b) Press Frequency-> Stop Freq-> 100 MHz;
c) Press BW-> 1 MHz.
These values can be entered from the keyboard or the universal control knob.
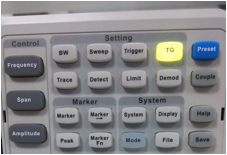
3. Enable the tracking generator by pressing TG Button-> TG on
4. Enter an appropriate tracking generator output power. For example, -10 dBm.
Press TG level-> -10 -> dBm.
Excessive signal power may damage the device under test so the output power should not exceed the maximum power rating of the DUT.
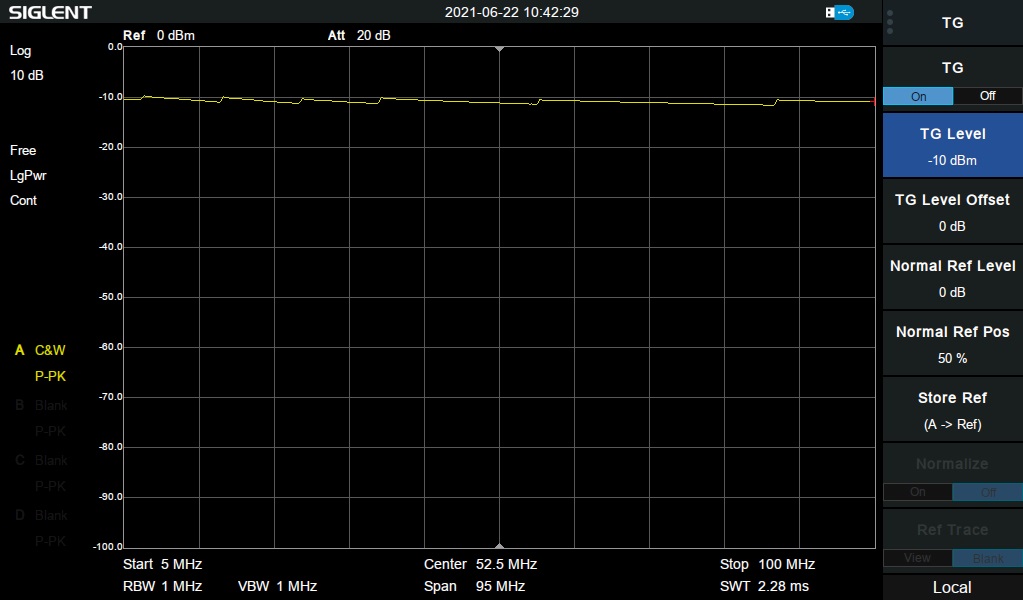
5. Press Stor Ref to save the reference trace.
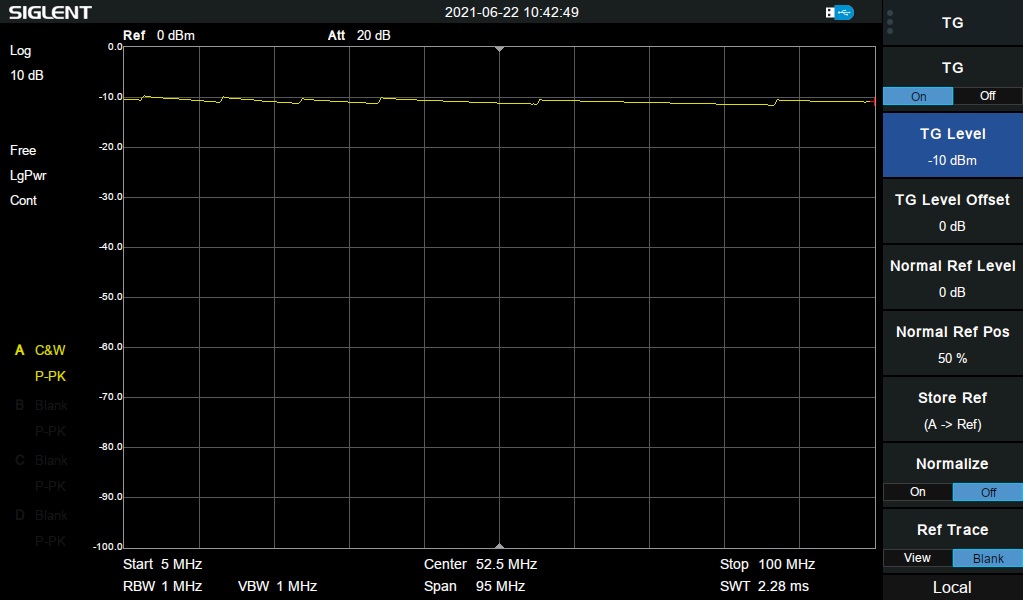
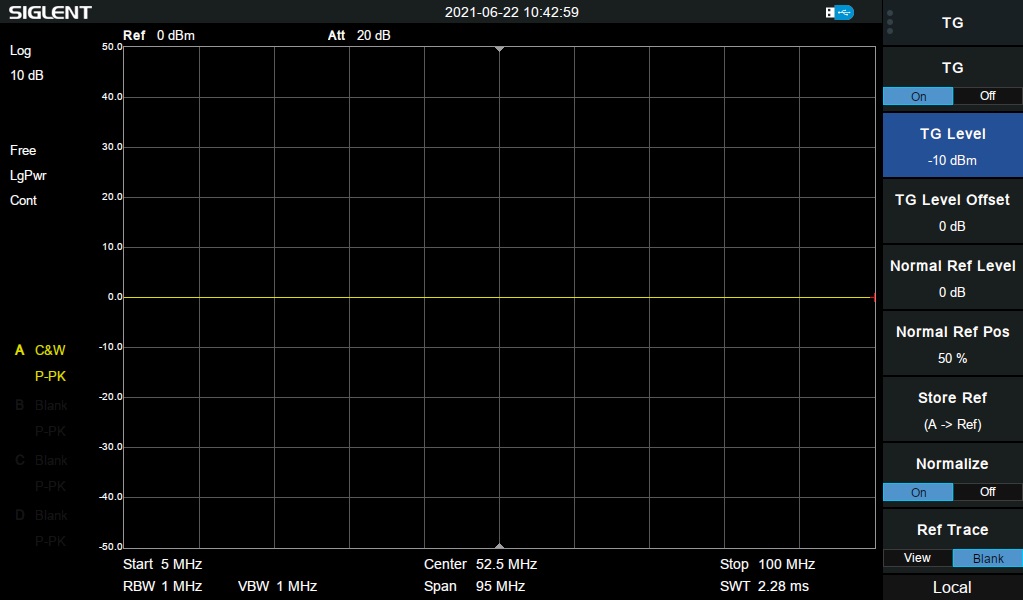
6. Press Normalize > ON to normalize the trace
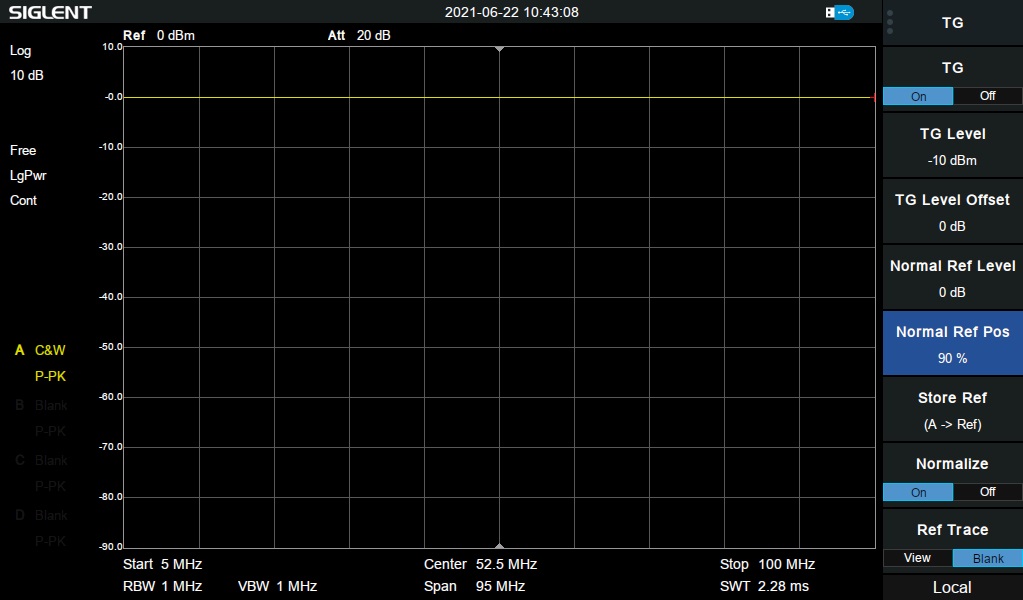
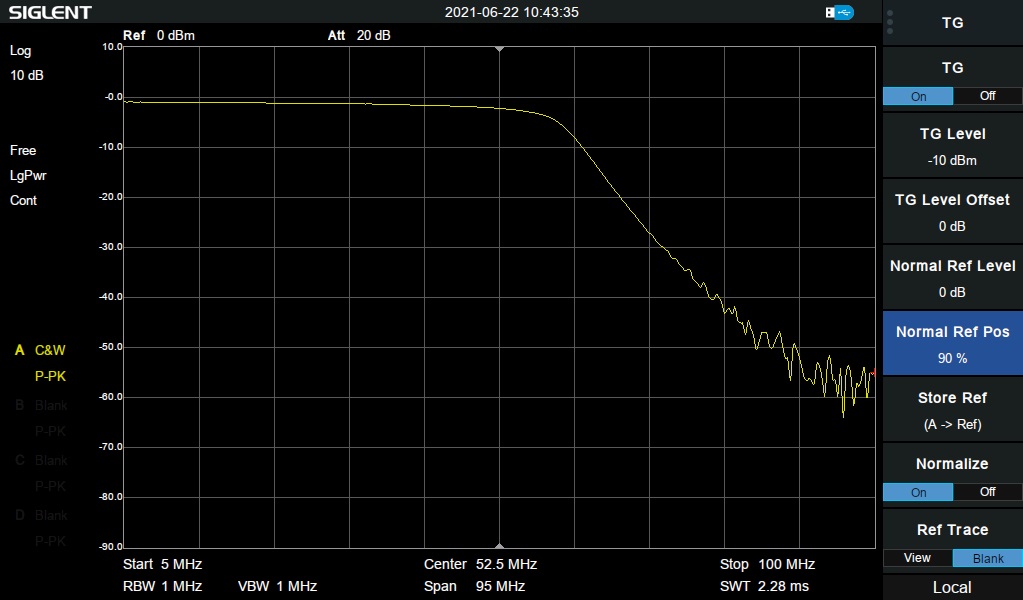
7. Press Norm Ref Pos -> 90%. This will allow for a convenient location on the spectrum analyzer screen to observe the filter’s frequency response curve.
Step 2: Measure
1. Connect the filter (device under test) as shown below:

The frequency response curve of the low-pass filter is now displayed on the screen without pressing any additional keys.
2. Measuring the 3 dB Bandwidth of the filter:
a) Press Marker and move the marker to the 3 dB point using the knob or keypad.
The 3 dB bandwidth of the filter is now automatically calculated and displayed: 57.133 MHz;

.