Enhanced TDR Measurements with the SIGLENT SNA5000A Vector Network Analyzer
May 17, 2023
Click here to download the complete document.
Introduction
Time Domain Reflectometry (TDR) is an important method for measuring cable and connection quality for high-speed transmissions. Some measurements that broadly fall into this category include characteristics like distance to fault as TDR makes it easy to visualize impedance changes over distance. Some of the basic analysis modes can be implemented on cable analyzers and basic spectrum analyzers, but advanced TDR measurements make it possible to evaluate much more subtle and elusive transmission quality issues. When TDR capabilities are built into a powerful multiport, multipath Vector Network Analyzer advanced visualization and analysis becomes possible. One important methodology is the use of simulated eye diagrams on high-speed communication channels. These eye diagram can be implemented on a number of device topologies with de-embedding using a 4-port network analyzer while providing important data visualizations including mask testing and injected jitter. This application note discusses the advanced TDR implementation and capabilities of the Siglent SNA5000A vector network analyzers while comparing the quality of 2 standard USB cables.
Differential Measurements and DUT Topology
As it is with many VNA measurements, configuration and calibration are two of the most important steps in acquiring quality data to guide design and improvement. Siglent’s Vector Network Analyzer (figure 1) includes a setup wizard to simplify device configuration and calibration to de-embed cables and connections.
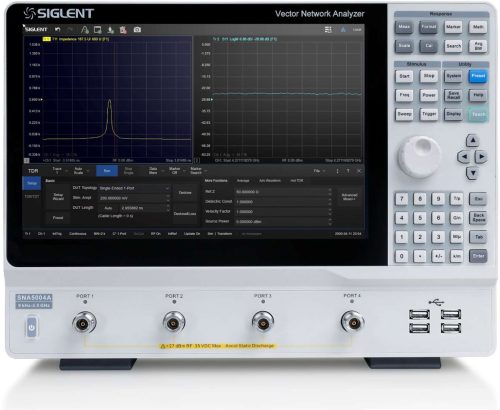
Figure 1: Siglent SNA5000A VNA with Enhanced TDR Option is used for all these images and measurements.
TDR Mode is entered through the MATH menu. Once turned on, enter the Setup Wizard to begin. The first setup step is deciding on DUT topology (Figure 2).
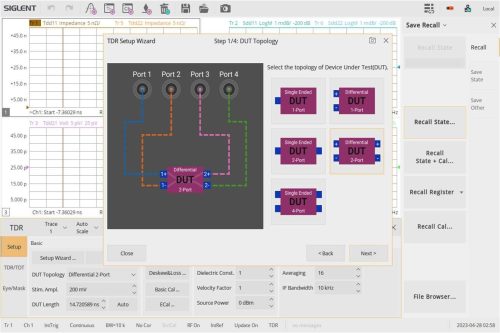
Figure 2: DUT Topology in the TDR Setup Wizard
With a 4 port VNA, complete differential measurements are possible. This is important for high performance signals and systems that routinely use differential signaling for high-speed communication. Here we will use a 2 port differential topology to test our USB cables. We have two differential SMA to USB-A connectors that we are connecting to the VNA using N to SMA cables and adaptors. The next steps in the Setup Wizard assist with calibration and deskew of these cables and connections for our selected topology. Figure 3 shows the first open calibration wizard window. This is followed by some thru connections and optional load connections to calibrate the setup for your device. Additional mechanical calibration or Ecal can be conducted from the TRD Setup interface as well.
Once the Setup Wizard is complete, you can configure the traces on the display for the desired measurements. In this topology, you can select from the following options:
| Tdd11 | Tdd12 | Tdc11 | Tdc12 |
| Tdd21 | Tdd22 | Tdc21 | Tdc22 |
| Tcd11 | Tcd12 | Tcc11 | Tcc12 |
| Tcd21 | Tcd22 | Tcc21 | Tcc22 |
These measurements are time domain parameters where the c and d (for example in: Tcd12) indicate whether the output port and input port are configured for differential or common measurements respectively. The 1 and 2 indicate the output and input port numbers. Traditional scattering parameters, like Sdd12, can also be selected by changing the time domain option. In S parameter mode, other measurement formats including Smith charts can be shown. For our cable test, we will use Tdd12 to measure the differential transmission quality.

Figure 3: TDR Setup Wizard Deskew calibration
Use the Auto Scale function to scale all of the traces and we can visualize any of the parameters that are of interest. The SNA5000A can create up to 256 traces at once. Much of the analysis can be done from the view shown in Figure 4. The time-domain traces completely characterize the device under test. We can take a quick look to make sure our device is connected properly and measuring within established parameters. Now, we are ready to move to the eye diagram view for advanced characterization of this connection.
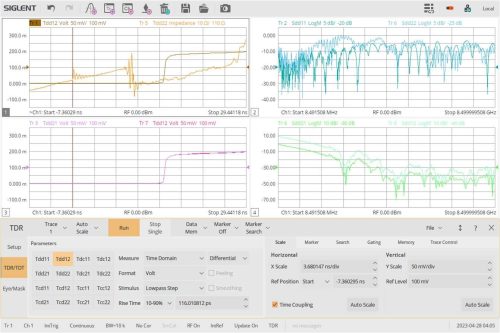
Figure 4: Tdd12 Trace Setup