SSA5000A IQA&IFO Operation Manual
January 16, 2024
1. IQ Acquisition
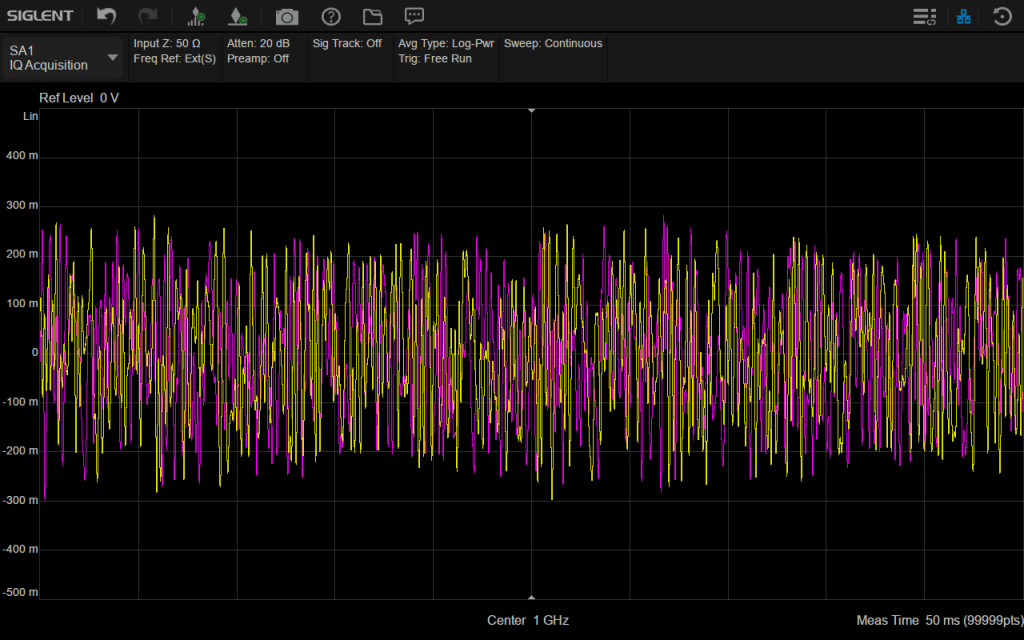
IQ acquisition is similar to zero-span measurement in Swept SA, where the input signal is displayed as I/Q data results. It is commonly used for measuring digital modulated signals and supports exporting IQ data to txt files for users to perform data demodulation and analysis. The IQA window presents the I and Q signal waveforms, depicting the voltage changes over time. The I signal is represented by the yellow trace, while the Q signal is represented by the purple trace. I/Q views provided in spectrum measurements enables users to examine complex components of the same signal without the need to modify settings or measurements.
1.1 Amplitude
Configuring the amplitude parameters of the analyzer makes the display of the measured signal visually appealing and minimizes measurement errors. By adjusting these parameters, the signal can be displayed in the current window in an easily observable format. Once the amplitude parameters have been modified, the measurement process will commence anew.
1.1.1 Ref Value
The reference line may be positioned top, center or bottom of the marker by setting a reference value.1.2 Scale/Div
Configuring the unit for each vertical scale division in the logarithmic display can be done by either manually setting the value or enabling automatic scaling, which is determined by the measured results.
1.1.2 Attenuation
Based on the magnitude of the input signal, the user configures the corresponding RF front-end attenuator and amplifier to avoid distortion when presenting large input signals and reduce noise when dealing with small input signals.
1.2 Sweep
1.2.1 Sweep/Measure
The analyzer can be set to perform a single Scan/Measure or continuous Scan/Measure by selecting the ‘Single’ or ‘Continue’ mode.
1.2.2 Restart
Restarting the current scan or measurement is achieved by initiating a re-Scan/Measure, particularly if the scan parameters have been modified.
1.3 Meas Setup
Click on the ‘Measurement Settings’ menu and select appropriate averaging parameters, center frequency, measurement time, and sampling rate based on the specific parameters of the acquired IQ signal.
1.3.1 Avg|Hold Number
Averaging|Hold count N represents the counter when the trace type is set to ‘Average’. In a single measurement (Single) and any valid trace type set to ‘Average’, the scan will stop when the counter reaches N.
A higher (Average|Hold) count can reduce the influence of noise or other random signals, highlighting the stable characteristics of the signal.
1.3.2 Averaging
Enable or disable the averaging calculation option for measurement results.
1.3.3 Avg Mode
Choose the control type for the averaging function. This determines the averaging operation after reaching the specified data acquisition count (average count).
Options include:
-Exponential (Exp): The measurement averages using a specified number of exponentially weighted averages. The average value is displayed at the end of each scan.
– Repeat: The measurement resets the average counter each time the specified number of averages is reached.
1.3.4 Center Freq
Ensure that the set center frequency matches the frequency of the IQ signal, otherwise the IQ waveform will not be displayed properly.
1.3.5 Meas Time
Set the time for signal acquisition, which represents the recording duration of the waveform. Due to memory limitations, the maximum measurement time may decrease when using a higher sampling rate.
1.3.6 Sample Rate
Set the sampling rate for signal acquisition, indicating the number of IQ pairs collected per second. Choose an appropriate sampling rate based on the specific IQ signal to avoid distortion in the acquired IQ signal.
1.4 Operation Demonstration
1)Input the 16QAM signal through the RF port of SSA5000A.
2)Use the IQ Acquisition to observe the I/Q signal waveform of the signal:
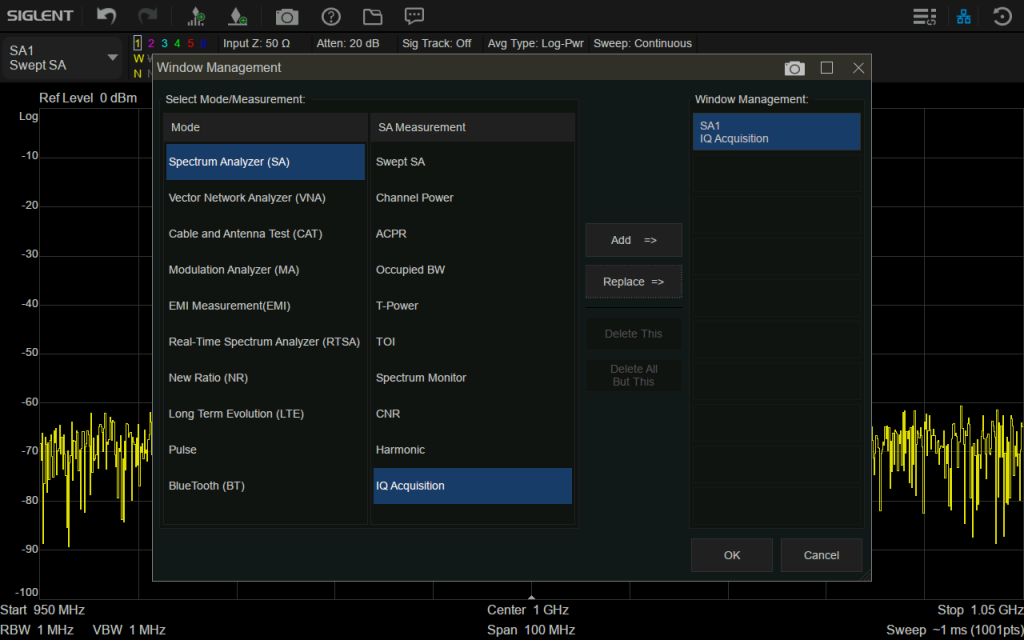
(1)Click Mode/Meas→Spectrum Analyzer(SA)→IQ Acquisition→Replace/Add→OK.
(2) Click FREQ, configure the center frequency corresponding to the IQ signal.
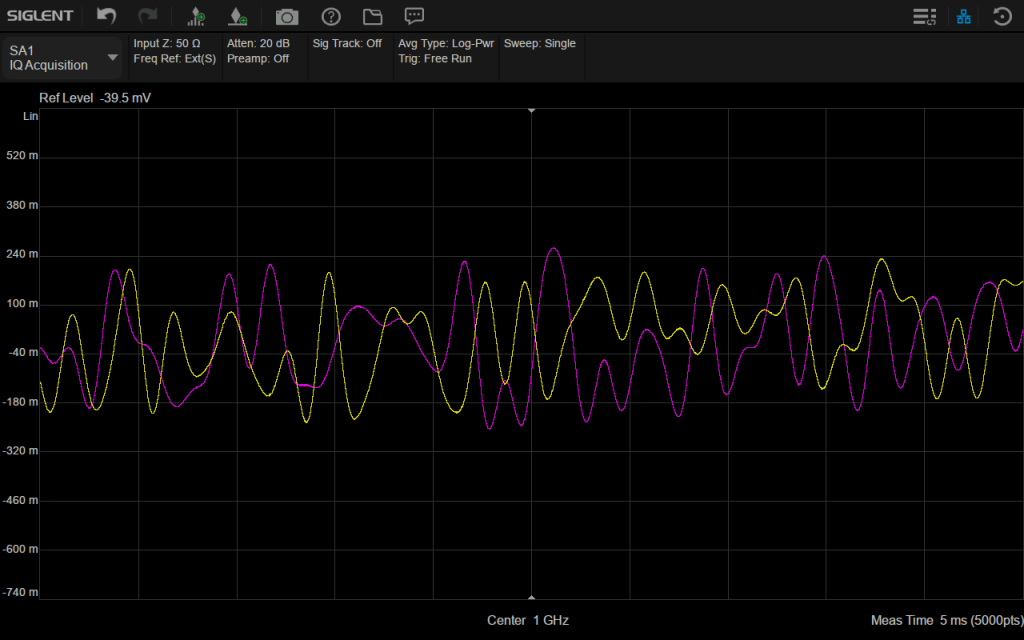
(3) Click AMPTD, Adjust the reference level, the scale and measurement time to better display the I/Q waveform on the screen.
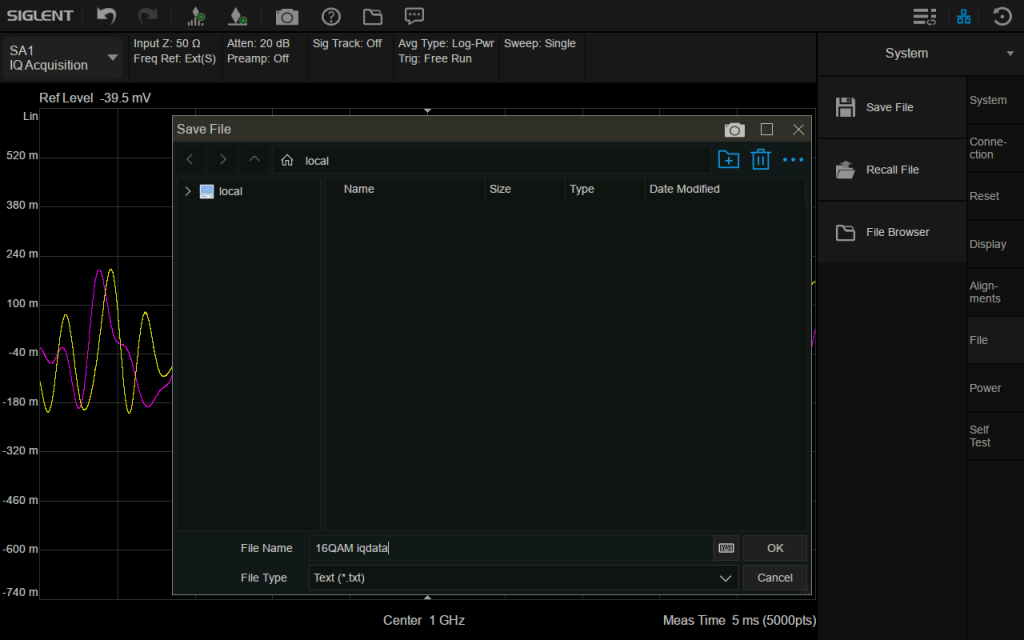
(4) Click Save/Recall, save IQ data as .txt file.
2. IF Output
The intermediate frequency (IF) output signal can be used for external signal processing and can be obtained via the ‘IF Out’ output connector on the instrument’s rear panel. Please note that the IF output is only useful in Zero Span.
The IF Out signal, centered at approximately 120MHz, is simply a down-converted version of the RF Input signal that is present at the tuned frequency. The bandwidth of the IF output signal is approximately 40MHz. Requires Option SSA5000-IFO.
2.1 Operation Demonstration
1)Input the RF signal to the RF port, and then output the IF signal through the IF Out connector on the rear panel.
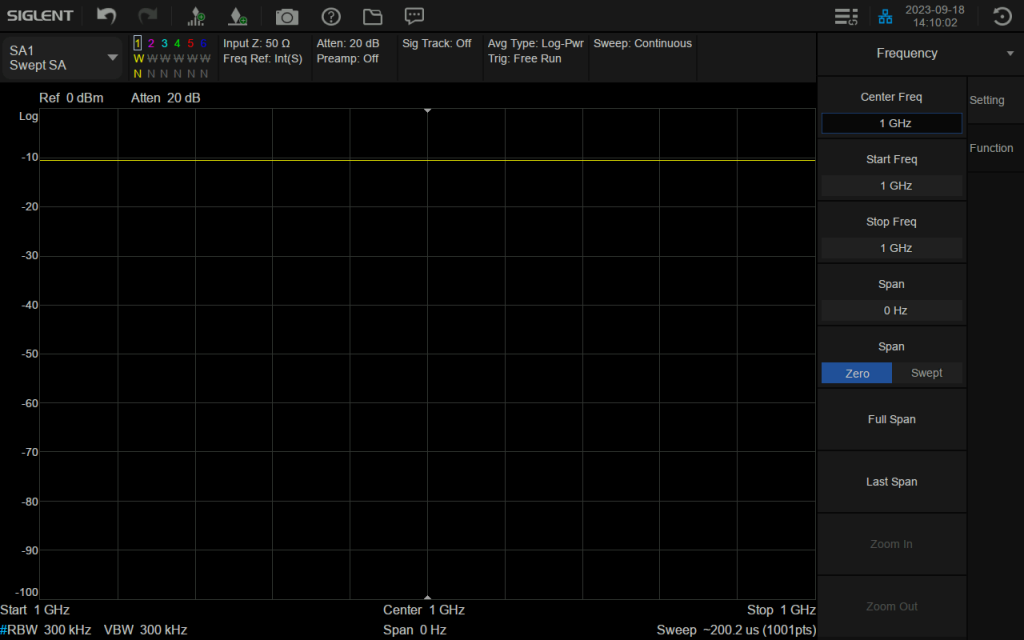
2)Click FREQ, configure the center frequency corresponding to the RF signal and turn on the Zero Span mode.
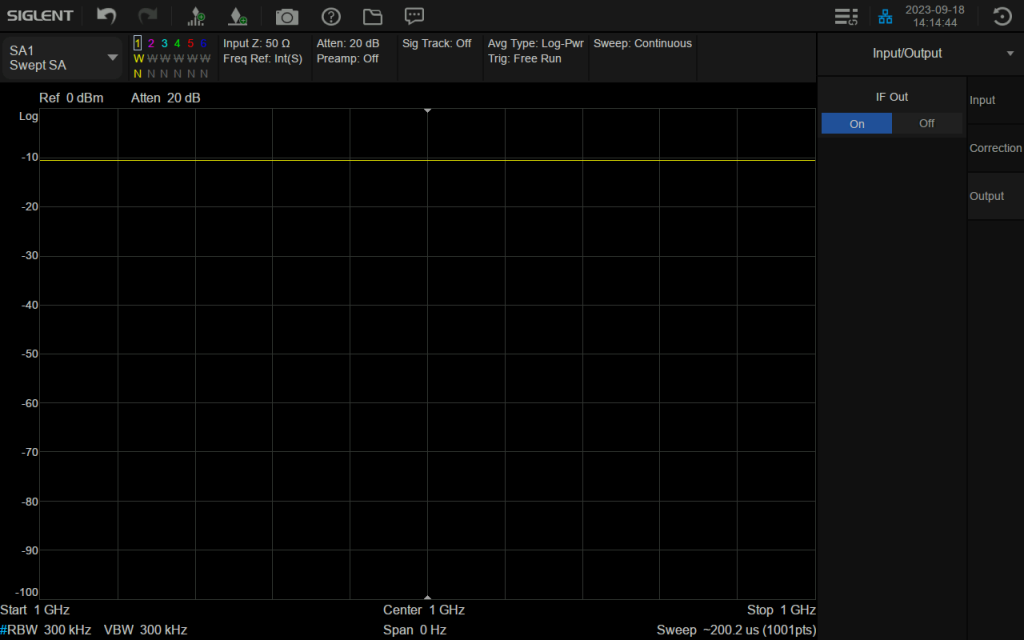
3)Click Input/Output, turn on the IF Out function.
4)Use another spectrum analyzer to observe the IF signal. Configure the center frequency to 120MHz and the span to 50MHz.
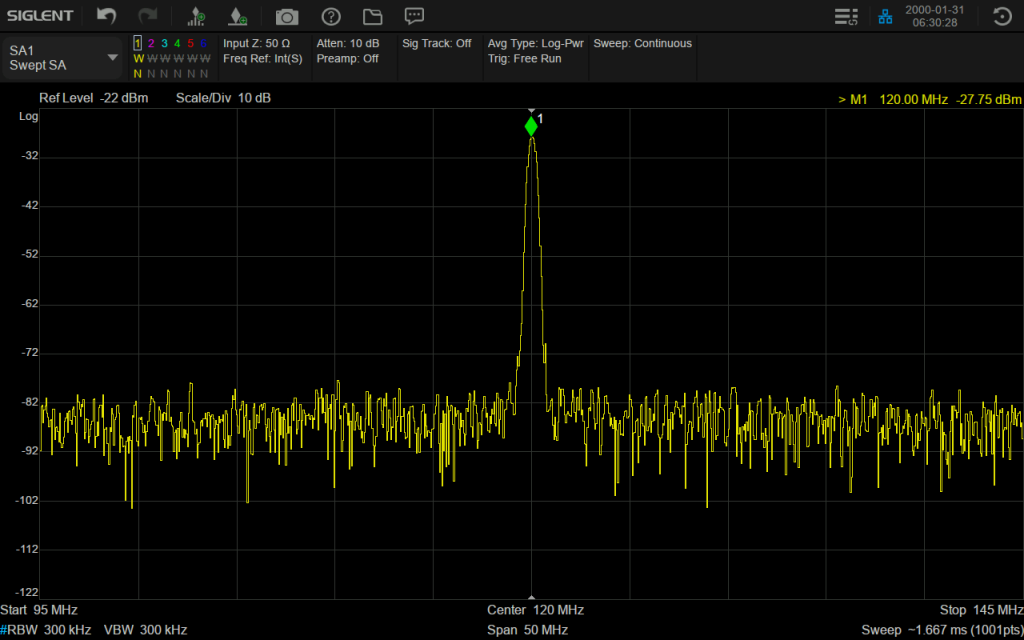
IF Output when input an 1GHz RF signal
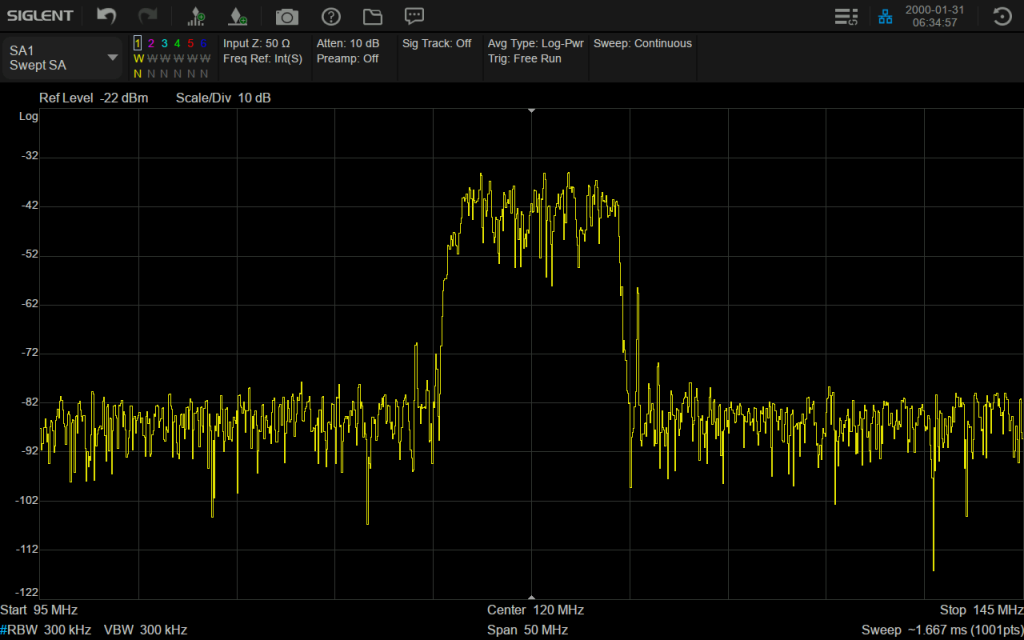
IF Output when input a 3.5 GHz NR signal