Using the SSA5000A phase noise analysis function
January 31, 2024
1 Introduction
A stable frequency source is a common need for many electronic devices and most RF equipment. Phase noise can be used to characterize the short-term frequency stability of these frequency sources. In this document, we will briefly describe how to use the phase noise analysis function of Siglent SSA5000A Spectrum analyzers
2 Typical Phase Noise Measurement Methods
Using the Spectrum analyzers’ spectrum analysis mode is the most typical and the most direct and widely used method to measure phase noise,shown as Figure 2 1.First measure the carrier power (Pc) in dBm. Next use the delta marker mode to set the marker to a specific frequency offset from the carrier, i.e. a point in the phase noise sideband. Then we measure the noise power (Pn) in 1 Hz bandwidth at that offset. If setting the resolution bandwidth (RBW) of the spectrum analyzer to 1Hz for scanning, it will take too long. You can use the noise marker function to normalize the noise measured by the RBW filter to 1Hz bandwidth. The power of the noise will be reduced by NdB after normalization, for which N=10*log(RBW/Hz). In the most cases, measuring phase noise requires repeating the process at different offsets from the carrier.
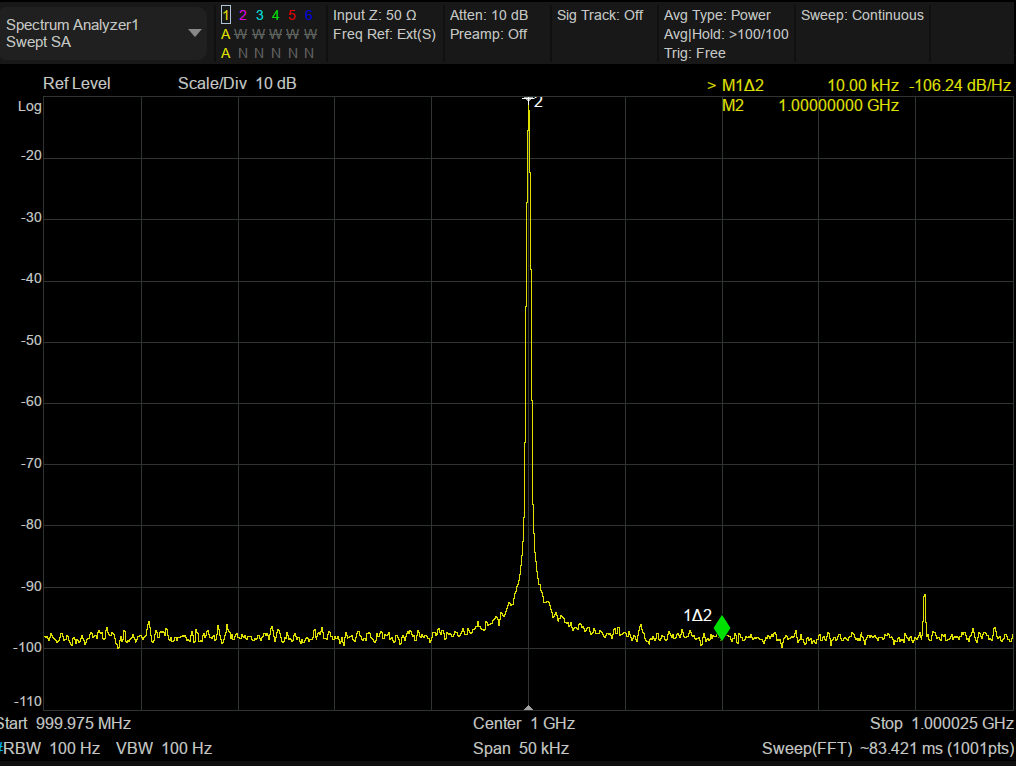
Figure 2‑1 Typical Phase Noise Measurement Methods
3 Phase noise analysis function
In practical measurements, it is often too cumbersome to repeat the measurement using different frequency offsets after loacated the carrier frequency. The SSA5000A offers an automated measurement method.
Click Spectrum Analyzer in the upper left corner after powering to enter the window management page. Click Phase Noise > Log Plot to add a window for phase noise analysis, and then the Spectrum analyzers will work in the phase noise measurement mode.
The working interface of phase noise analysis is similar to that of spectrum analysis, shown as follows:
① Mode/Measure:Indicate the current working mode and measurement function of the analyzer, and click to switch, such as spectrum analysis mode, real-time spectrum mode, etc.
② Instrument Configuration:Indicate the main working states of trace, interface, sweep, trigger, etc.
③ Measurement Result: Display the signal measurement results of the analyzer in various forms such as waveform, spectral line, cursor, table, statistics, constellation diagram, etc
④ Sweep Parameter: Indicate and control the main sweep parameters, such as frequency, resolution, scanning time, etc.
⑤ Menu: Complete the parameter setting of the analyzer.
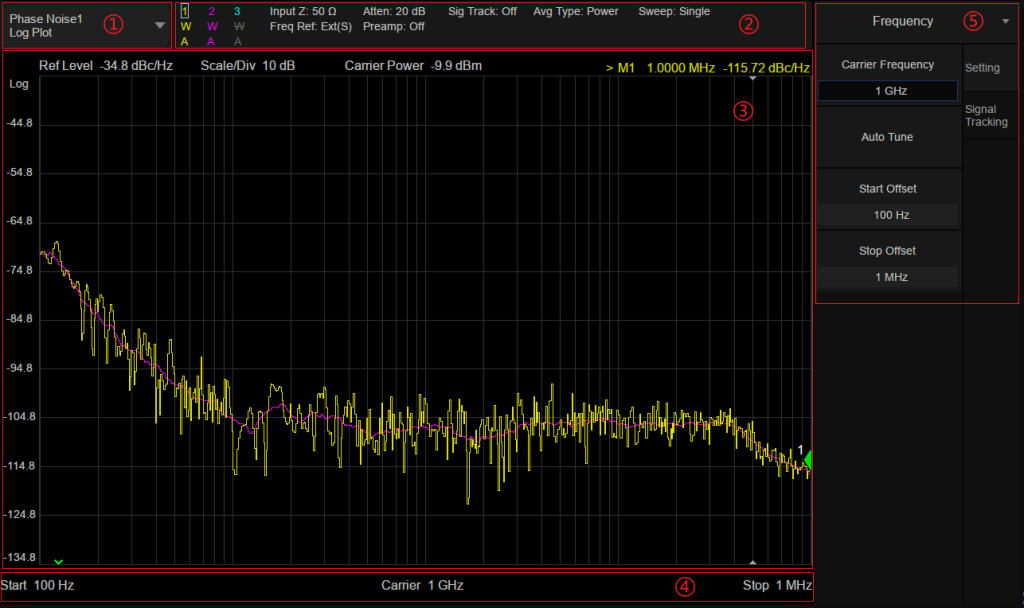
Figure 3‑1 Operation interface of phase noise analysis function
3.1 Frequency Settings
Carrier Frequency: set the frequency of the carrier.
Auto-tune: Spectrum analyzers will automatically locate and set the carrier frequency and set the offsets.
Start Offset: minimum offset from the carrier frequency.
Stop offset: maximum offset from the carrier frequency.
After completing the setup, the Spectrum analyzers will automate the measurement process and repeat the measurement within the defined frequency offset range.

Figure 3‑2 Frequency Settings
3.2 Signal Tracking Setup
Span: Since the input source is not always stable, it will have a frequency deviation around, resulting in biased test results. This function tracks the frequency deviation within a specified range, to minimize the effects of frequency deviation.
3.3 Test results reference
The single-sideband phase noise measured within the specified frequency offset range is shown in Figure 3 2. In the figure, the offset range is 100 Hz to 1 MHz. The log scale is used for the horizontal axis because in this way it is possible to obtain both a wider frequency range and a finer resolution when close to the carrier——smaller offsets tend to reflect the quality of the signal better than phase noise at larger frequency offsets.
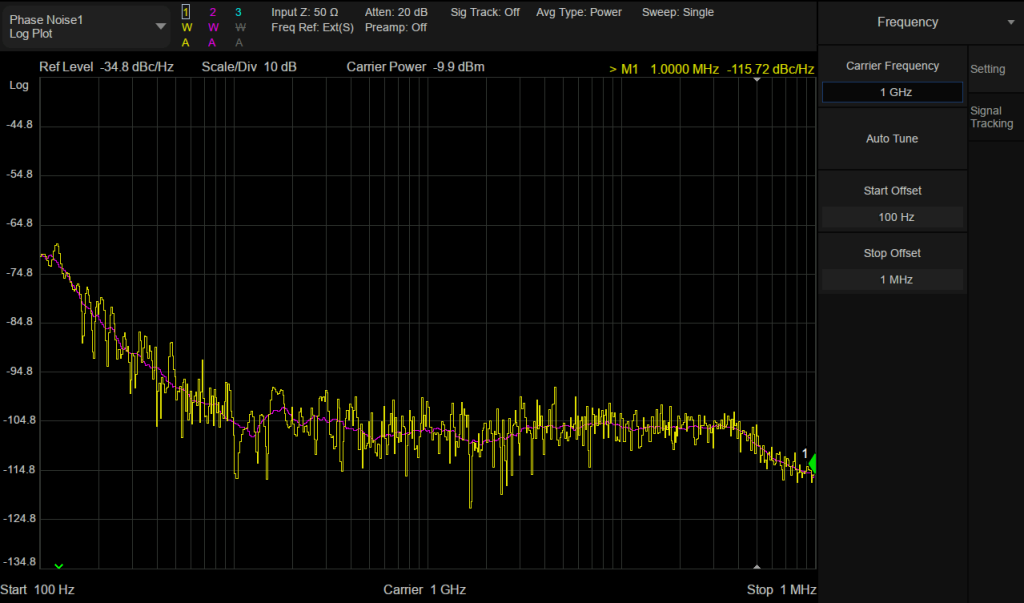
Figure 3‑3 Test results
In the Figure 3‑2, trace 1 is the original data and trace 2 is the smoothed single-sideband phase noise.
4 Advantages of SSA5000A phase noise function
4.1 Lower Displayed Average Noise Levels
When using the spectrum analyzer for phase noise measurements, the phase noise is calculated from the carrier power and the noise power at different offsets of the carrier. The noise power to be measured is generally small, and in order to keep the phase noise from being covered by the Spectrum analyzers’ display average noise level(DANL), the Spectrum analyzers’ display average noise level is required to be very low. The SSA5000A’s display average noise level is lower than -165dBm/Hz. Users can evaluate whether the input signal amplitude is appropriate and the measurement is correct based on DANL and the phase noise of the Spectrum analyzers.
4.2 Smaller resolution bandwidth
The performance of Spectrum analyzers is highly demanded when measuring phase noise with very small offsets from the carrier. A very narrow resolution bandwidth is required to avoid measuring carrier power and noise power in an RBW filter. The SSA5000A has a minimum resolution bandwidth of 1 Hz, and the starting frequency offset in the phase noise measurement function also supports a 1 Hz setting.
4.3 Lower phase noise
The phase noise of the Spectrum analyzers can also have an effect on the test. Spectrum analyzers usually have multiple local oscillators (LOs). During testing, the spectrum analyzer’s oscillators have their own phase noise, which will be added to the phase noise of the measured signal as it moves through different stages in the analyzer.
Therefore, when using a spectrum analyzer to measure phase noise, it is necessary to distinguish the phase noise in the original signal from the phase noise added by the instrument. The simplest way is to ensure that the spectrum analyzer’s phase noise specifications are far superior to the device under test (DUT). Siglent’s SSA5000A has a phase noise lower than -105 dBc/Hz@1GHz at 10kHz offset, which meets a considerable number of measurement requirements.