Programming Example: Python Power Supply Efficiency Example
June 21, 2021
Power supply efficiency is an important aspect of any power supply design. Using a few standard pieces of test gear, one can quickly build a modular system with enough resolution to measure the most demanding applications.
This note describes a Python example that we created as part of an application note which describes the basics of power supply efficiency testing, which is available here: Power Supply Efficiency App Note
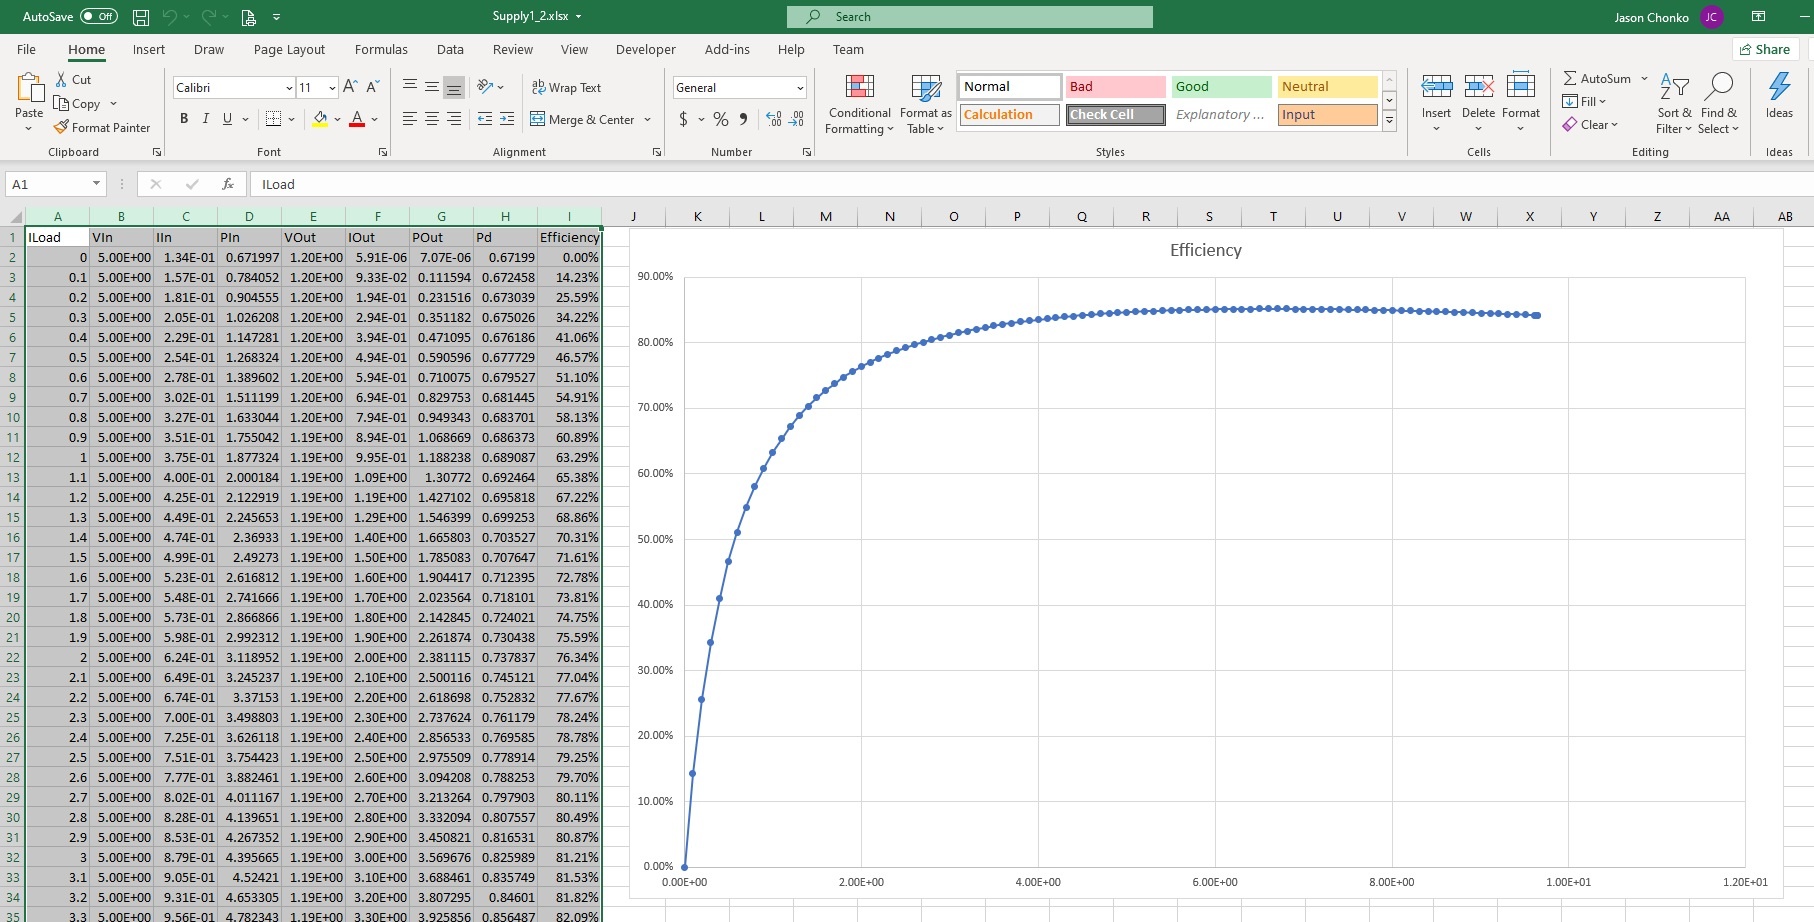
Typical power efficiency curves require 10 or more load current steps to get an accurate representation of efficiency. Manually performing this test can be a bit tedious and prone to error.
For the resolution question, consider that most commercial power supplies and DC loads have 3.5 digit measurement resolution and accuracy values that may not be high enough to characterize the DUT confidently.
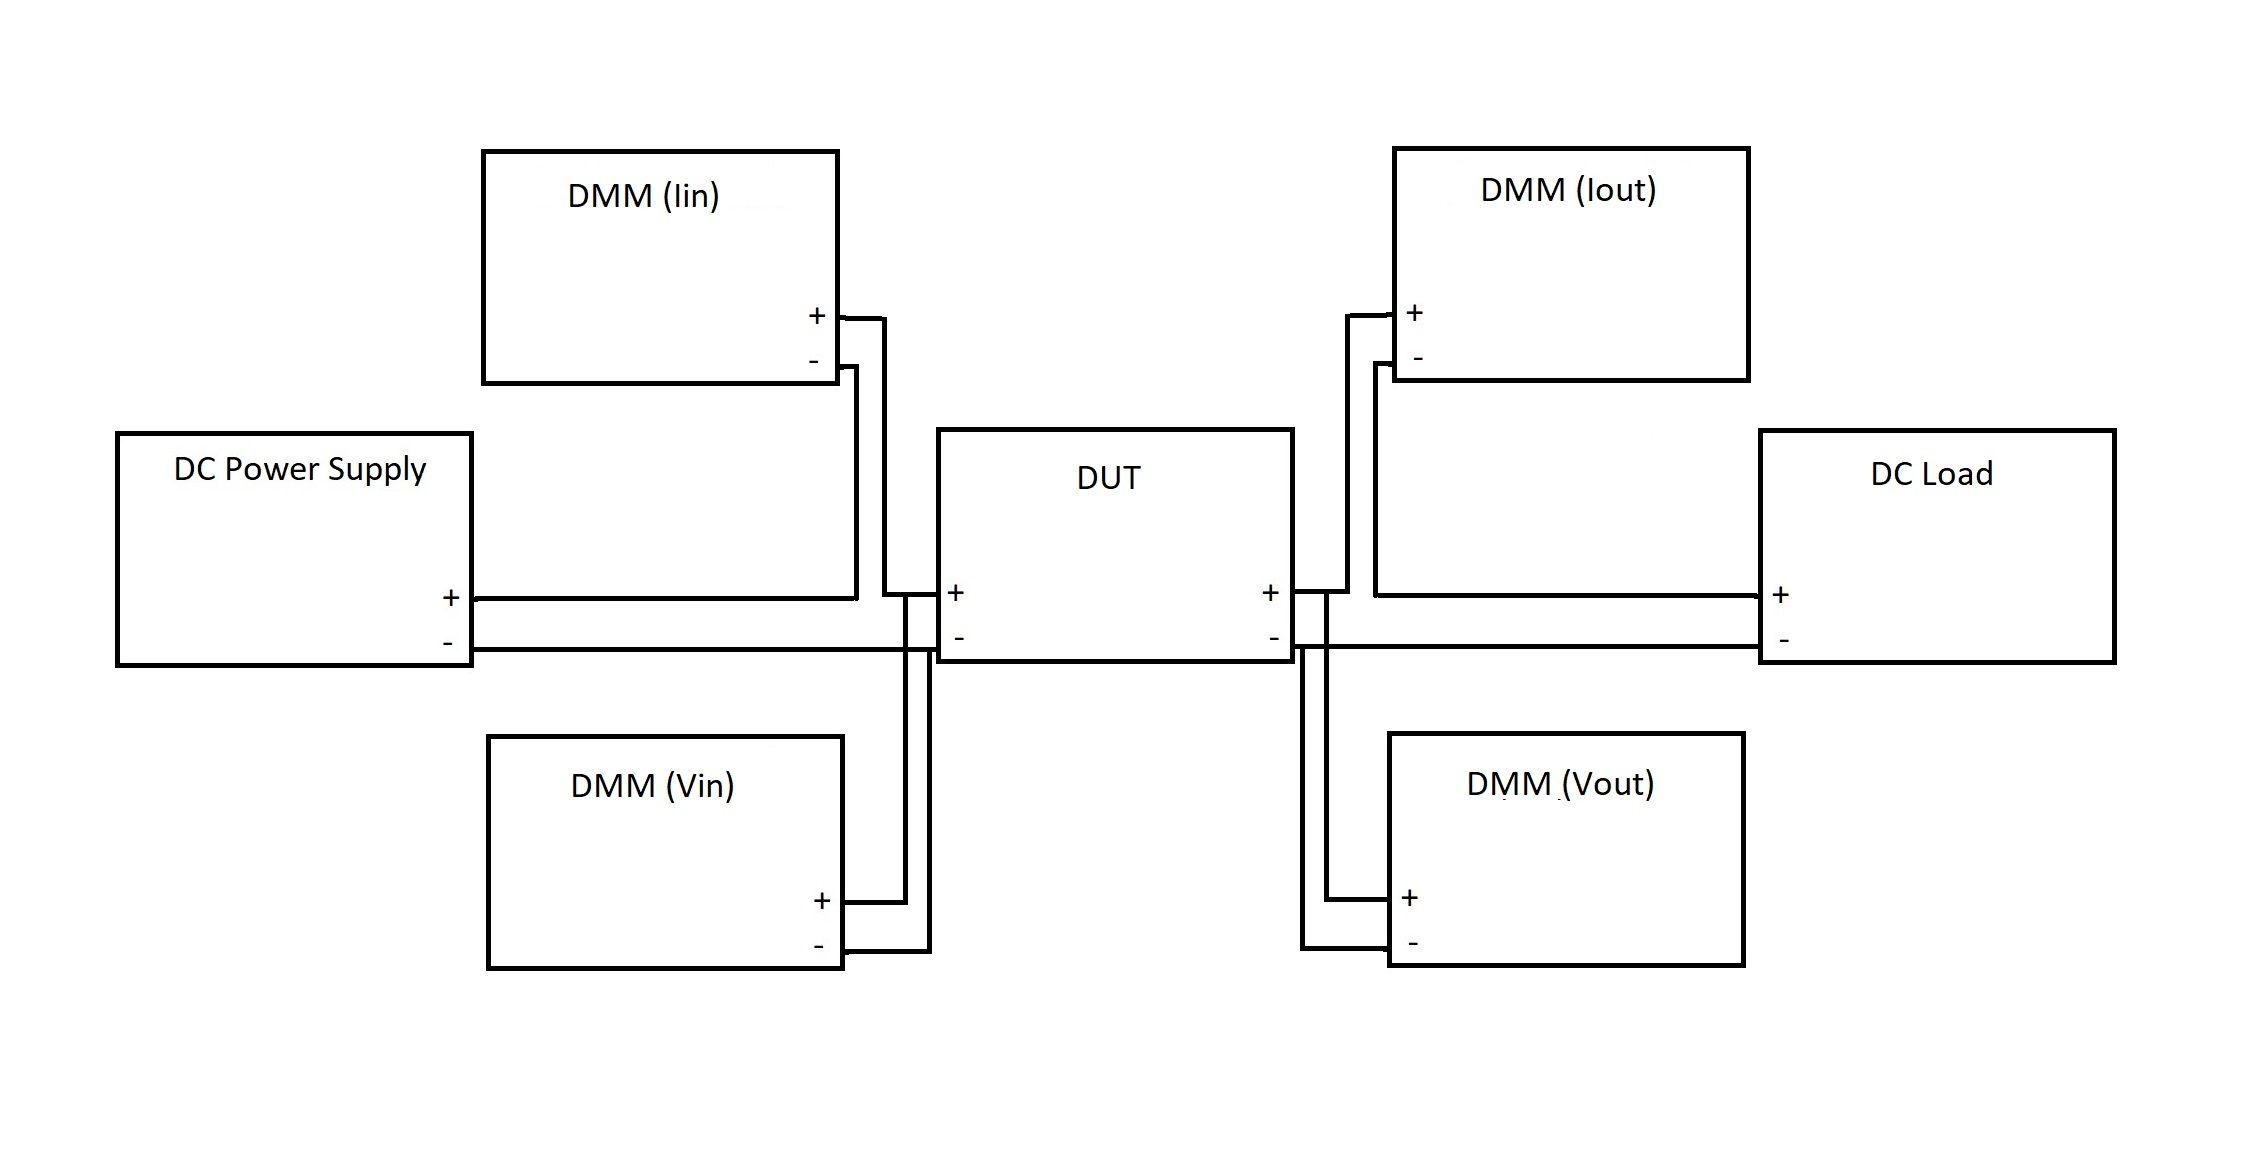
To address these two considerations, we added four multimeters: one to measure Vin, Iin, Vout, and Iout and created a computer program to automate the instrument configurations, step load current values, and data collection.
Here is a wiring diagram of the setup:
Software
Automating this type of test is a great way to minimize errors as well as speed up the test process.
We put together an example program using Python that performs the following:
-
- Prompts the user for start, stop, and number of current load steps
- Power Supply settings to deliver proper power to the DUT
- Filename to save the CSV data file
Requirements:
-
- Qty 1 SIGLENT SPD series power supply
- Qty 1 SIGLENT SDL1000X series DC electronic load
- Qty 4 SIGLENT SDM3000 series digital multimeter
- Qty 1 6 port or more USB hub, USB cables
- Cabling* to connect all instruments and DUT
- Python 3.0 or greater
- tkinter
- PyVISA
*Use the proper gauge wiring and connectors that are rated above the maximum current draw expected to minimize the risk of fire or overheating.
To run the program:
-
- Download Python 3.6, PyVISA, and tkinter (a module that eases Graphical User Interface creation)
- Download the program SIGLENT PS Efficiency.ZIP
- Connect instruments and DUT. It may be helpful to put a small label on each DMM to make it easier to visually identify their roles.
- Open the program using a Python editor like IDLE
- Edit the USB addresses for each instrument.
Here is a screenshot of the code showing the addresses:
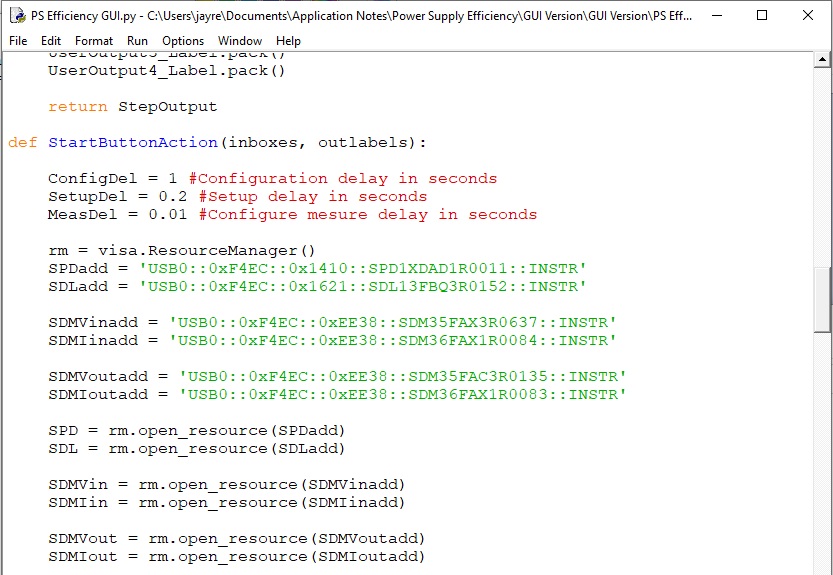
Where:
-
-
-
- SPDadd is the power supply address
- SDLadd is the electronic load address
- SDMVinadd is the address of the DMM measuring the input voltage
- SDMIinadd is the address of the DMM measuring the input current
- SDMVoutadd is the address of the DMM measuring the output voltage
- SDMIoutadd is the address of the DMM measuring the output current
-
-
One easy way to establish the USB addresses is to use the National Instruments MAX application. With Max, you can connect the instruments via USB and check all of the addresses:
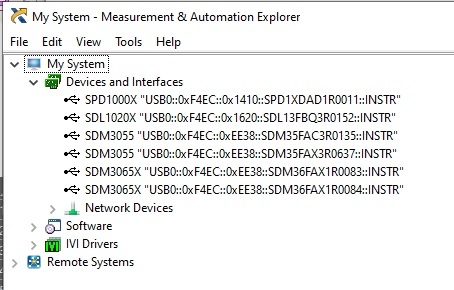
NOTE: The USB resource ID contains the instrument serial number, which can be used to help identify which instrument you are communicating with. As noted above, it may be helpful to put a small label on each instrument including the serial number to make it easier to visually identify each instrument and ensure they are wired correctly for their role in the test.
-
- After wiring everything up, you can run the module.
- The first thing you should see is the User Interface (UI) as shown below:
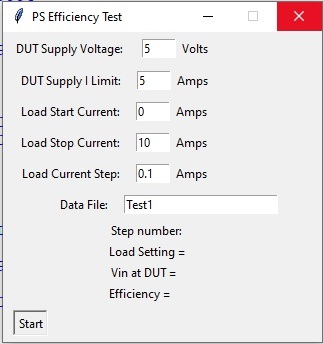
-
- Enter the proper values for each entry and press Start
- As the process begins, you should see the output indicator on the power supply turn on, the DC Load input light should turn on, and the displayed values for current and voltage should meet your programmed values
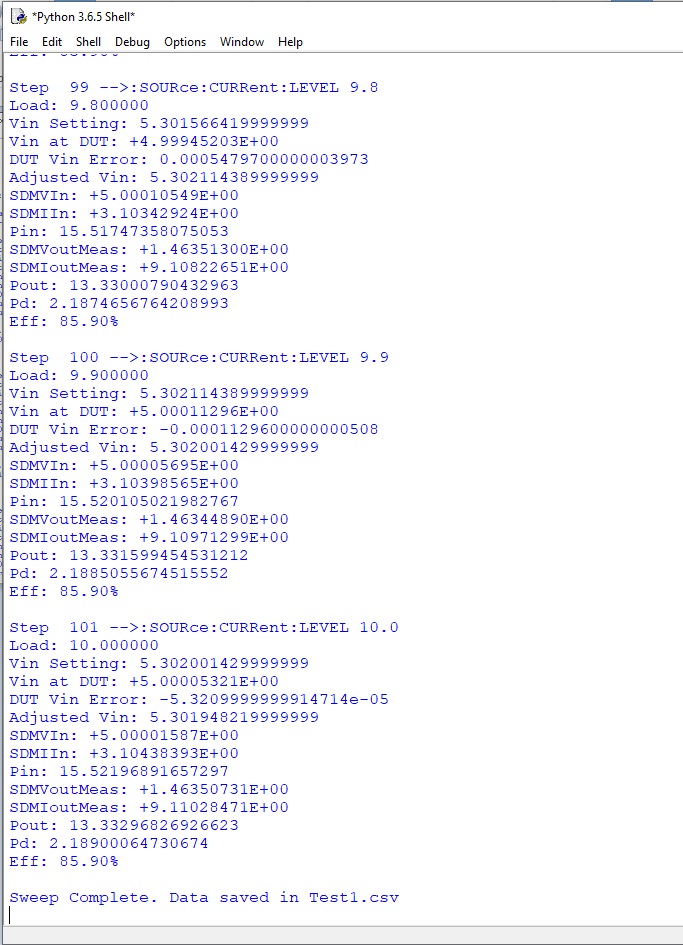
- The program prints each step value measurement on the display as shown here:
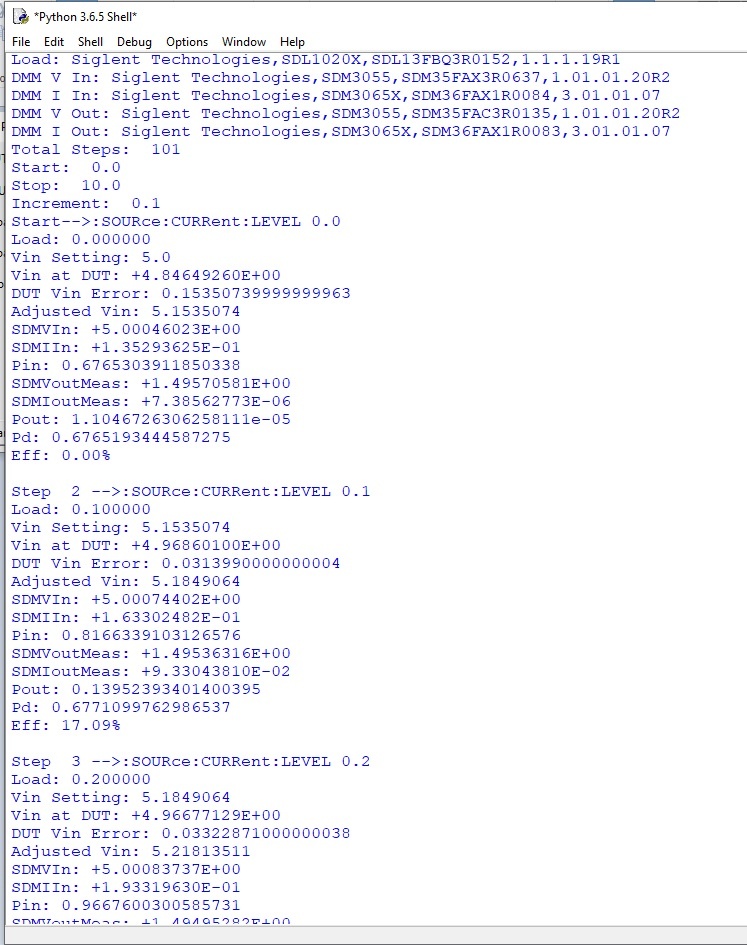
This program uses the auto-ranging measurement function of each instrument, which can add time to each measurement. For proper DC measurements, there needs to be some time delay at each step value to ensure a stable reading. We have programmed sufficient delays for most DUTs, but you may need to tweak delays to meet your specific test needs.
-
- Upon completion, the program will indicate that it is complete and write a CSV file to the folder where the Python program is located.
- Find the CSV file, copy columns A – I:
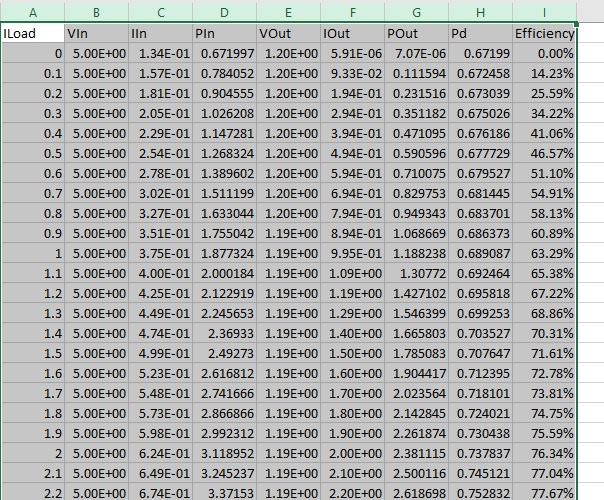
- Open a copy of the file Efficiency Template.xls included in the program folder, and paste the results to plot the curve: