Create an arbitrary waveform using Coordinate Mode with EasyWave software
August 24, 2018
There are a number of ways to create waveforms for arbitrary generators. The correct method depends on:
- The number of segments of the waveform?
- Required precision of the location of each sample?
- Complexity of the waveform? Is it a number of pulses or a number of complex curves/small details?
For sequences of pulses/square waves or to precisely control the location of each data point, it may be easiest to build the waveform by defining each data point used in the waveform.
In this note, we are going to show how to use the coordinate mode to build a waveform using SIGLENT EasyWave software.
Let’s start by taking a look at how the arbitrary waveform works with many generators.
- Each waveform is comprised of samples
- Each sample has a time and amplitude value
- The available samples and amplitudes for a generator can be visualized as a rectangle
The first sample is at time = 0 and can have any amplitude within the capabilities of the instrument.
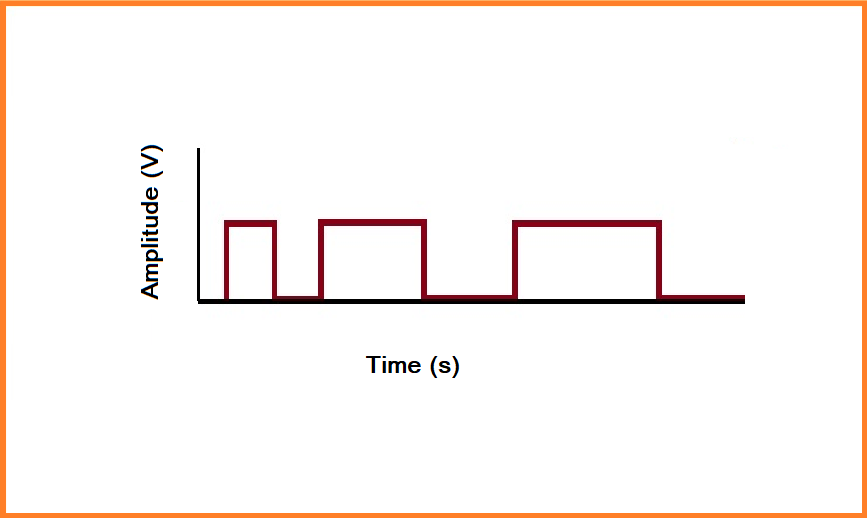
Here is a simple waveform:
Now, you can see that there are distinct transitions (highlighted by blue stars):
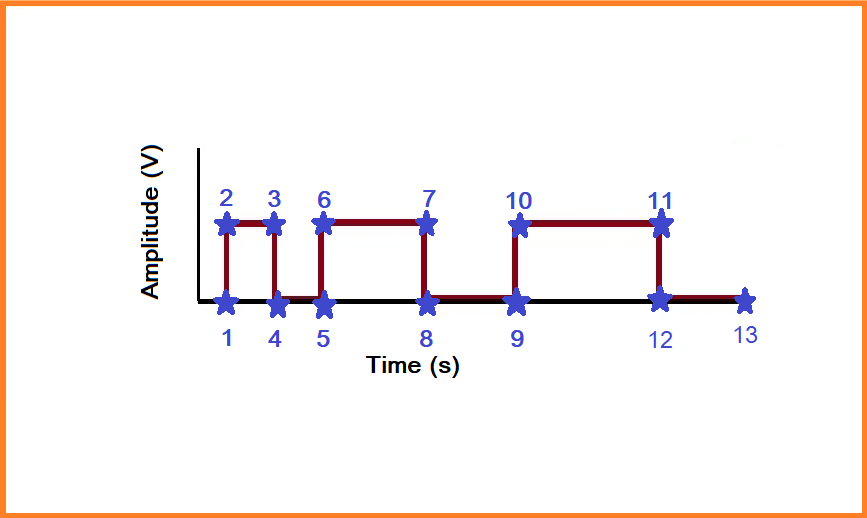
Each of these transitions has a specific time and amplitude value which can be built into a table of time and amplitude coordinates. These coordinates can be used to replicate the waveform exactly.
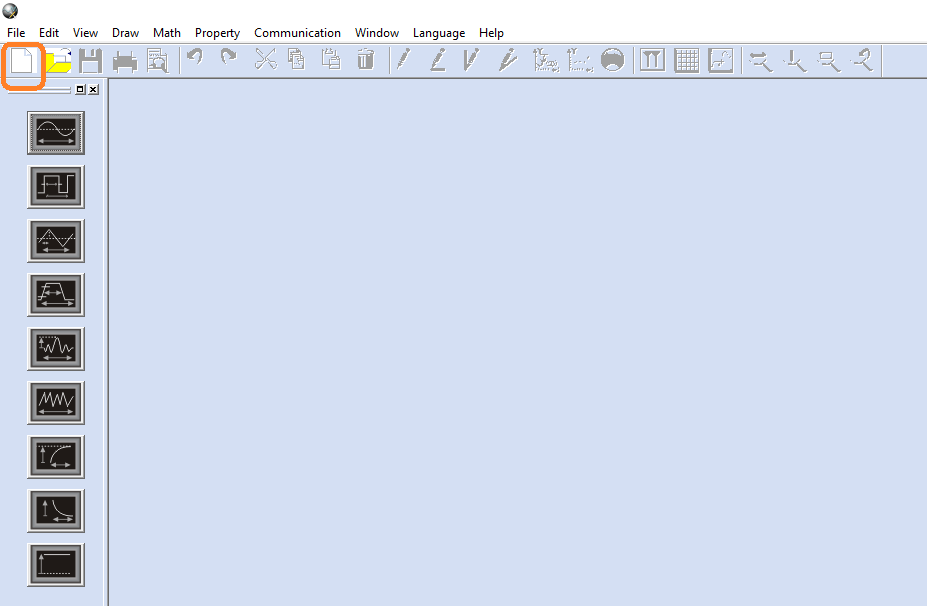
- Now, let’s open up EasyWave and select New File:
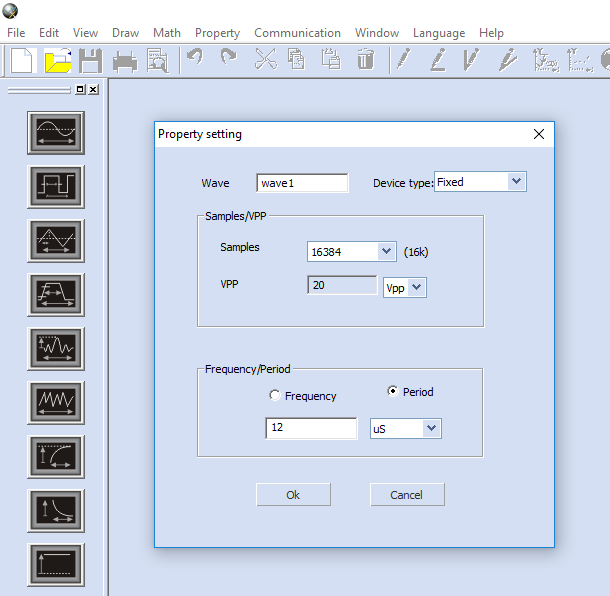
- Set the waveform period/frequency and name. NOTE: In this example, we are programming an SDG1000X instrument, which has a fixed sample depth (16,384 samples). In this case, we set the period to 12 us:
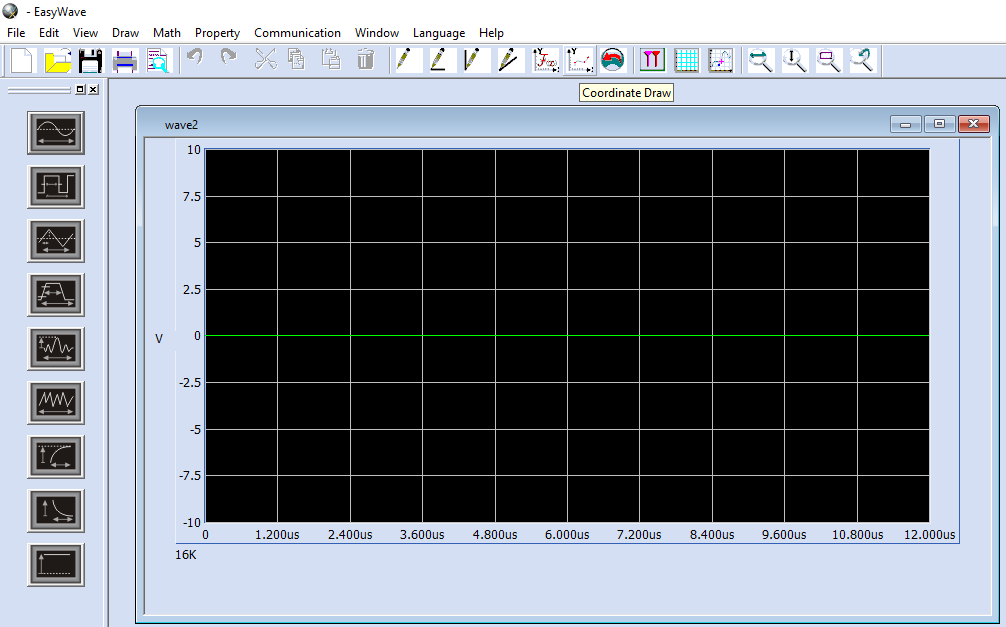
After selecting OK, the software will build a window showing the amplitude and period of the memory block you have created for this waveform:
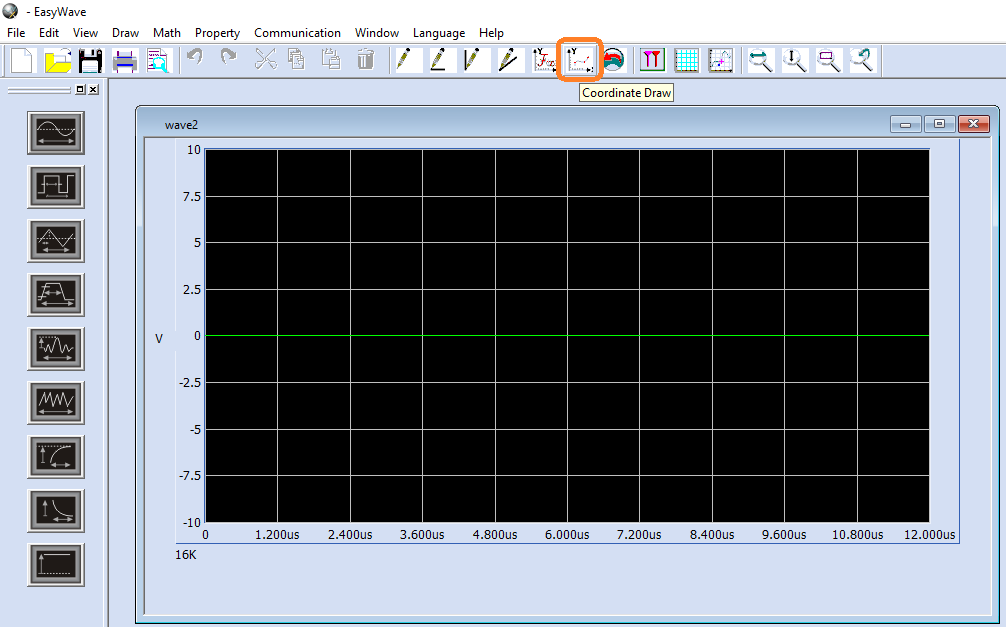
- Now, select Coordinate Draw from the top menu:
- A new window appears with three columns: #NO (sample number), XPos (sample time in us), and YPos (sample amplitude in volts).
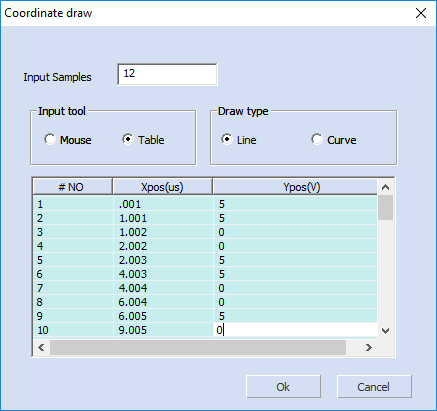
- In this example, we have chosen to enter each value manually using the table and we have set the software to draw a line between each point. This is ideal for creating flat segments for pulse trains.
NOTE: Each sample has to have a unique XPos. For nearly vertical line segments, just add the smallest amount of time to the XPos. Here, the minimum value is 0.001 us. So, everywhere there is a vertical segment, simply add 0.001 us to the XPos.
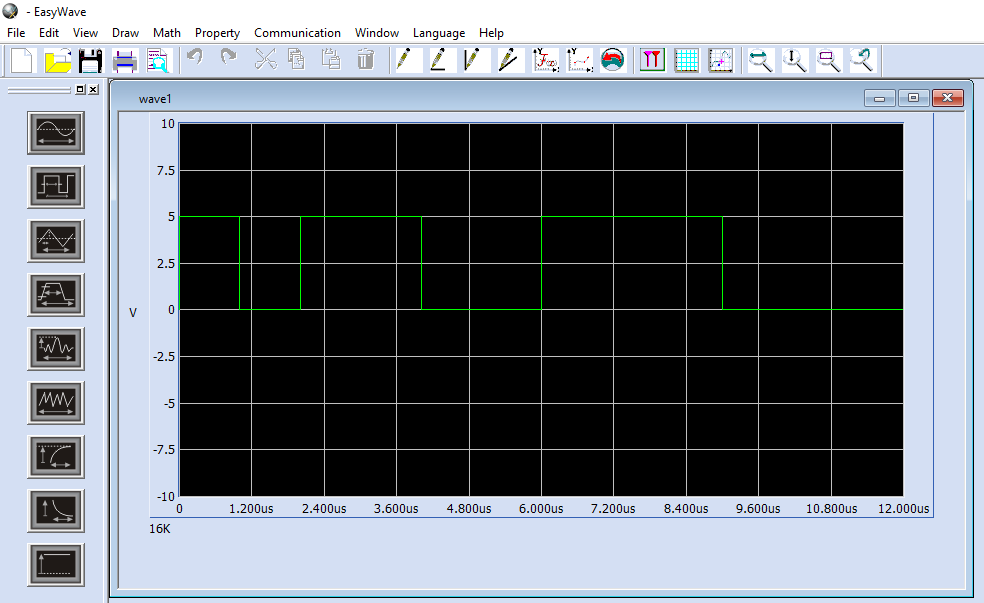
- Once you have filled in all of the values, press OK. The green line should now represent the waveform you created:
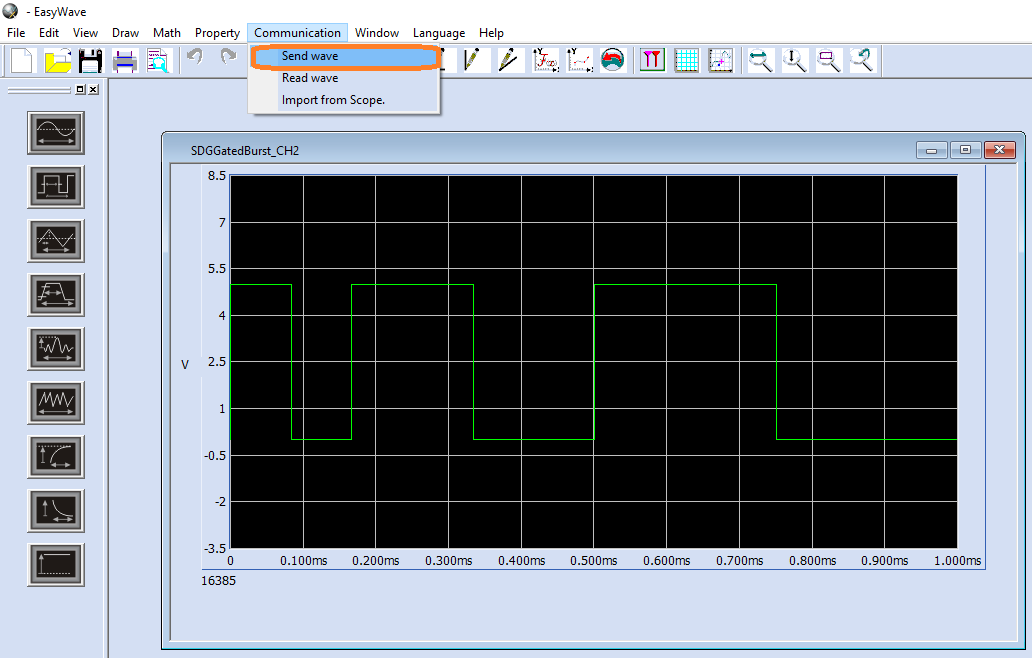
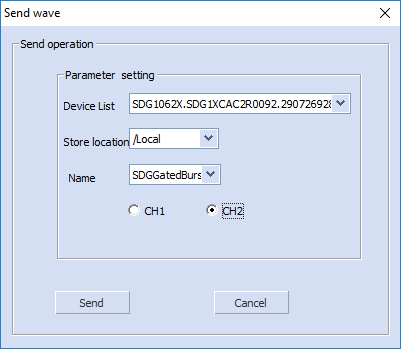
- If everything is OK, you can connect your SDG generator to the computer and download the waveform:
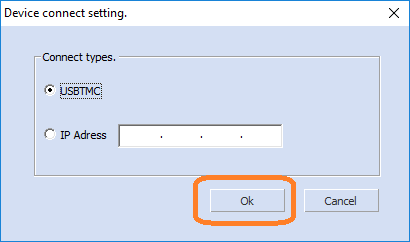
- For a USB connection to the instrument, select USBTMC:
- Select the generator (USB device) and the output channel you wish to send the waveform to:
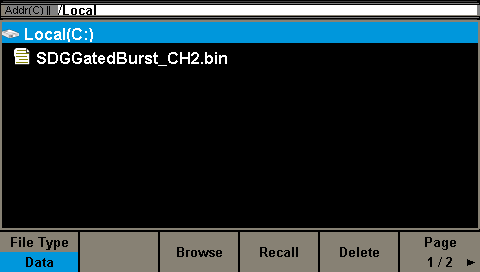
NOTE: This saves the waveform as a binary file (*.BIN file extension) in the SDG non-volatile memory using the name shown. You can verify by pressing Store/Recall on the instrument:
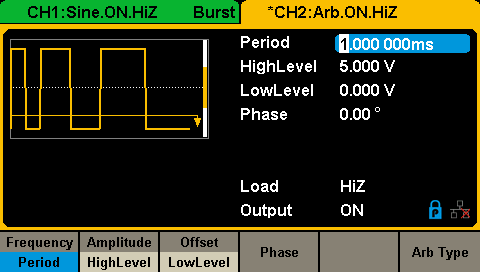
- The generator should now show you the waveform:
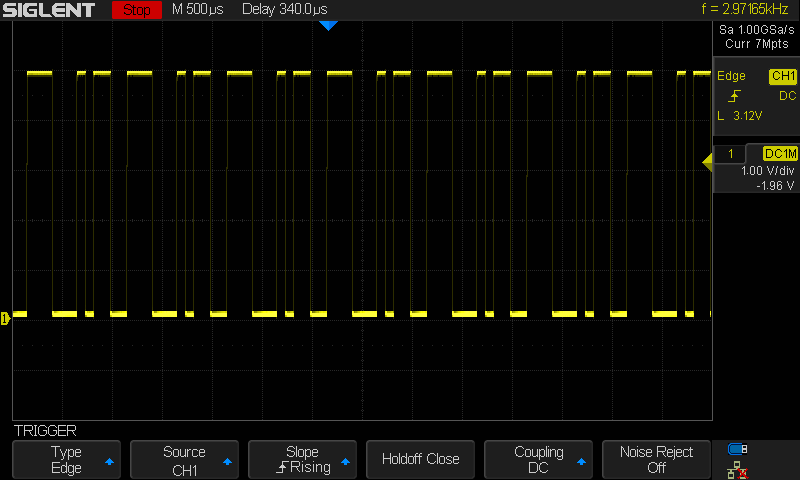
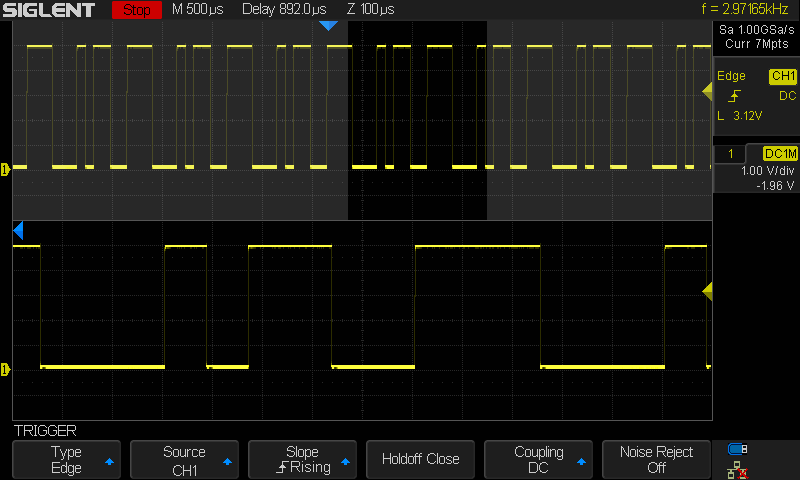
Now, you can verify the output using an oscilloscope: