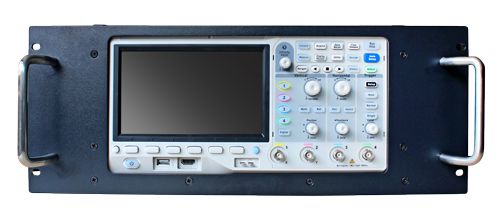
SDS2000X-E Series Super Phosphor Oscilloscopes
- 200MHz, 350MHz bandwidth models
- Real-time sampling rate up to 2 GSa/s
- The newest generation of SPO technology
- Waveform capture rate up to 110,000 wfm/s (normal mode), and
400,000 wfm/s (sequence mode) - Supports 256-level intensity grading and color display modes
- 7-inch TFT-LCD display and 10 one-button menus
- Record length up to 28 Mpts
- Digital trigger system
- Bode plot
Product Overview
SIGLENT’s new SDS2000X-E Series Super Phosphor Oscilloscopes are available in two bandwidths; 200 MHz and 350 MHz. They each have a maximum sampling rate of 2 GSa/s and a standard record length of 28 Mpts. The most commonly used functions can be accessed with its user-friendly one-button design.
The SDS2000X-E oscilloscope series employs a new generation of SPO technology. With its excellent signal fidelity, background noise is lower than similar products in the industry. It has a minimum vertical input range of 500 uV/div, an innovative digital trigger system with high sensitivity and low jitter, and a waveform capture rate of 400,000 frames/sec (sequence mode). It also employs a 256-level intensity grading display function and a color temperature display mode not found in other models in this class. Siglent’s newest oscilloscope offering supports multiple powerful triggering modes including serial bus triggering and decoding. History waveform recording and sequential triggering allow for extended waveform records to be captured, stored, and analyzed. Also included is the deep memory FFT. This math function uses up to 1 M samples for the FFT calculation, providing the SDS2000X-E with very high frequency resolution. The hardware co-processor executes true fast measurement and math to all of 28M sample points so that there is minimal distortion on analysis. It also supports searching and navigating, on-screen Bode plot, 16 channel digital /MSO , an external USB powered 25 MHz AWG function generator module (option) and an embedded application that allows remote control via web browser. The features and high-performance of the SDS2000X-E oscilloscopes cannot be matched else anywhere at this price.
Having trouble deciding which scope is right for you?
Click to view a comparison table of our most powerful scopes.
| Bandwidth | Channels | Real time sampling rate | Capture rate | Memory depth | Price | ||
| SDS2202X-E | 200 MHz | 2+EXT | 2 GSa/s | 110,000 wfm/s (normal mode) | 28 Mpts/CH | $619 | Discontinued |
| SDS2352X-E | 350 MHz | 2+EXT | 2 GSa/s | 110,000 wfm/s (normal mode) | 28 Mpts/CH | $839 | Discontinued |
Key Features
- Intelligent triggers: Edge, Slope, Pulse Width, Window, Runt, Interval,Time out (Dropout), Pattern
- Serial bus triggering and decoding (standard), supports protocols IIC, SPI, UART, CAN, LIN
- Low background noise with voltage scales from 500 μV/div to 10 V/div
- 10 types of one-button shortcuts, supports Auto Setup, Default, Cursors, Measure, Roll, History, Display/Persist, Clear Sweep, Zoom and Print
- History waveform record (history) function (maximum recorded waveform length is 80,000 frames)
- 1 Mpt FFT
- Math and measurement functions use all sampled data points in memory (up to 28 Mpts)
- Math functions (FFT, addition, subtraction, multiplication, division, integration, differential, square root)
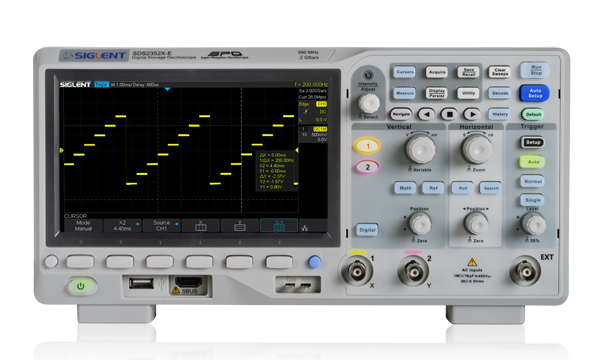
- Large 7 inch TFT -LCD display with 800 * 480 resolution
- Supports Multi-language display and embedded online help
7-inch TFT-LCD display with 800 * 480 resolution. Most commonly used functions are accessible using 10 different one-button operation keys: Auto Setup, Default, Cursor, Measure, Roll, History, Persist, Clear Sweep, Zoom, Print.
Product Characteristics

Maximum sample rate of 2 GSa/s, record Length of up to 28Mpts View more
Maximum sample rate of 2 GSa/s, record Length of up to 28Mpts
Using hardware-based Zoom technologies and max record length of up to 28Mpts, users are able to oversample to capture for longer time periods at higher resolution and use the zoom feature to see more details within each signal.
Waveform Capture Rate up to 400,000 wfm/s View more
Waveform Capture Rate up to 400,000 wfm/s
With a waveform capture rate of up to 400,000 wfm/s (sequence mode),
the oscilloscope can easily capture the unusual or low-probability events.
Serial Bus Decoding Function (Standard) View more
Serial Bus Decoding Function (Standard)
SDS2000X-E displays the decoding through the events list. Bus protocol
information can be quickly and intuitively displayed in a tabular format.
History Waveforms (History) Mode and Segmented Acquisition (Sequence) View more
History Waveforms (History) Mode and Segmented Acquisition (Sequence)
Playback the latest triggered events using the history function.
Segmented memory collection will store trigger events into multiple
(Up to 80,000) memory segments, each segment will store triggered
waveforms and timestamp of each frame.
True measurement to 28 M points View more
True measurement to 28 M points
SDS2000X-E can apply automatic measurements on all sampled data
points up to 28 Mpts. This ensures the accuracy of measurements while
the math co-processor decreases measurement time and increases easeof-use.
1 Mpoint FFT View more
1 Mpoint FFT
The new math co-processor enables FFT analysis of incoming signals
using up to 1 million samples per waveform. This provides high frequency
resolution with a fast refresh rate. The FFT function also supports a
variety of window functions so that it can adapt to different spectrum
measurement needs.
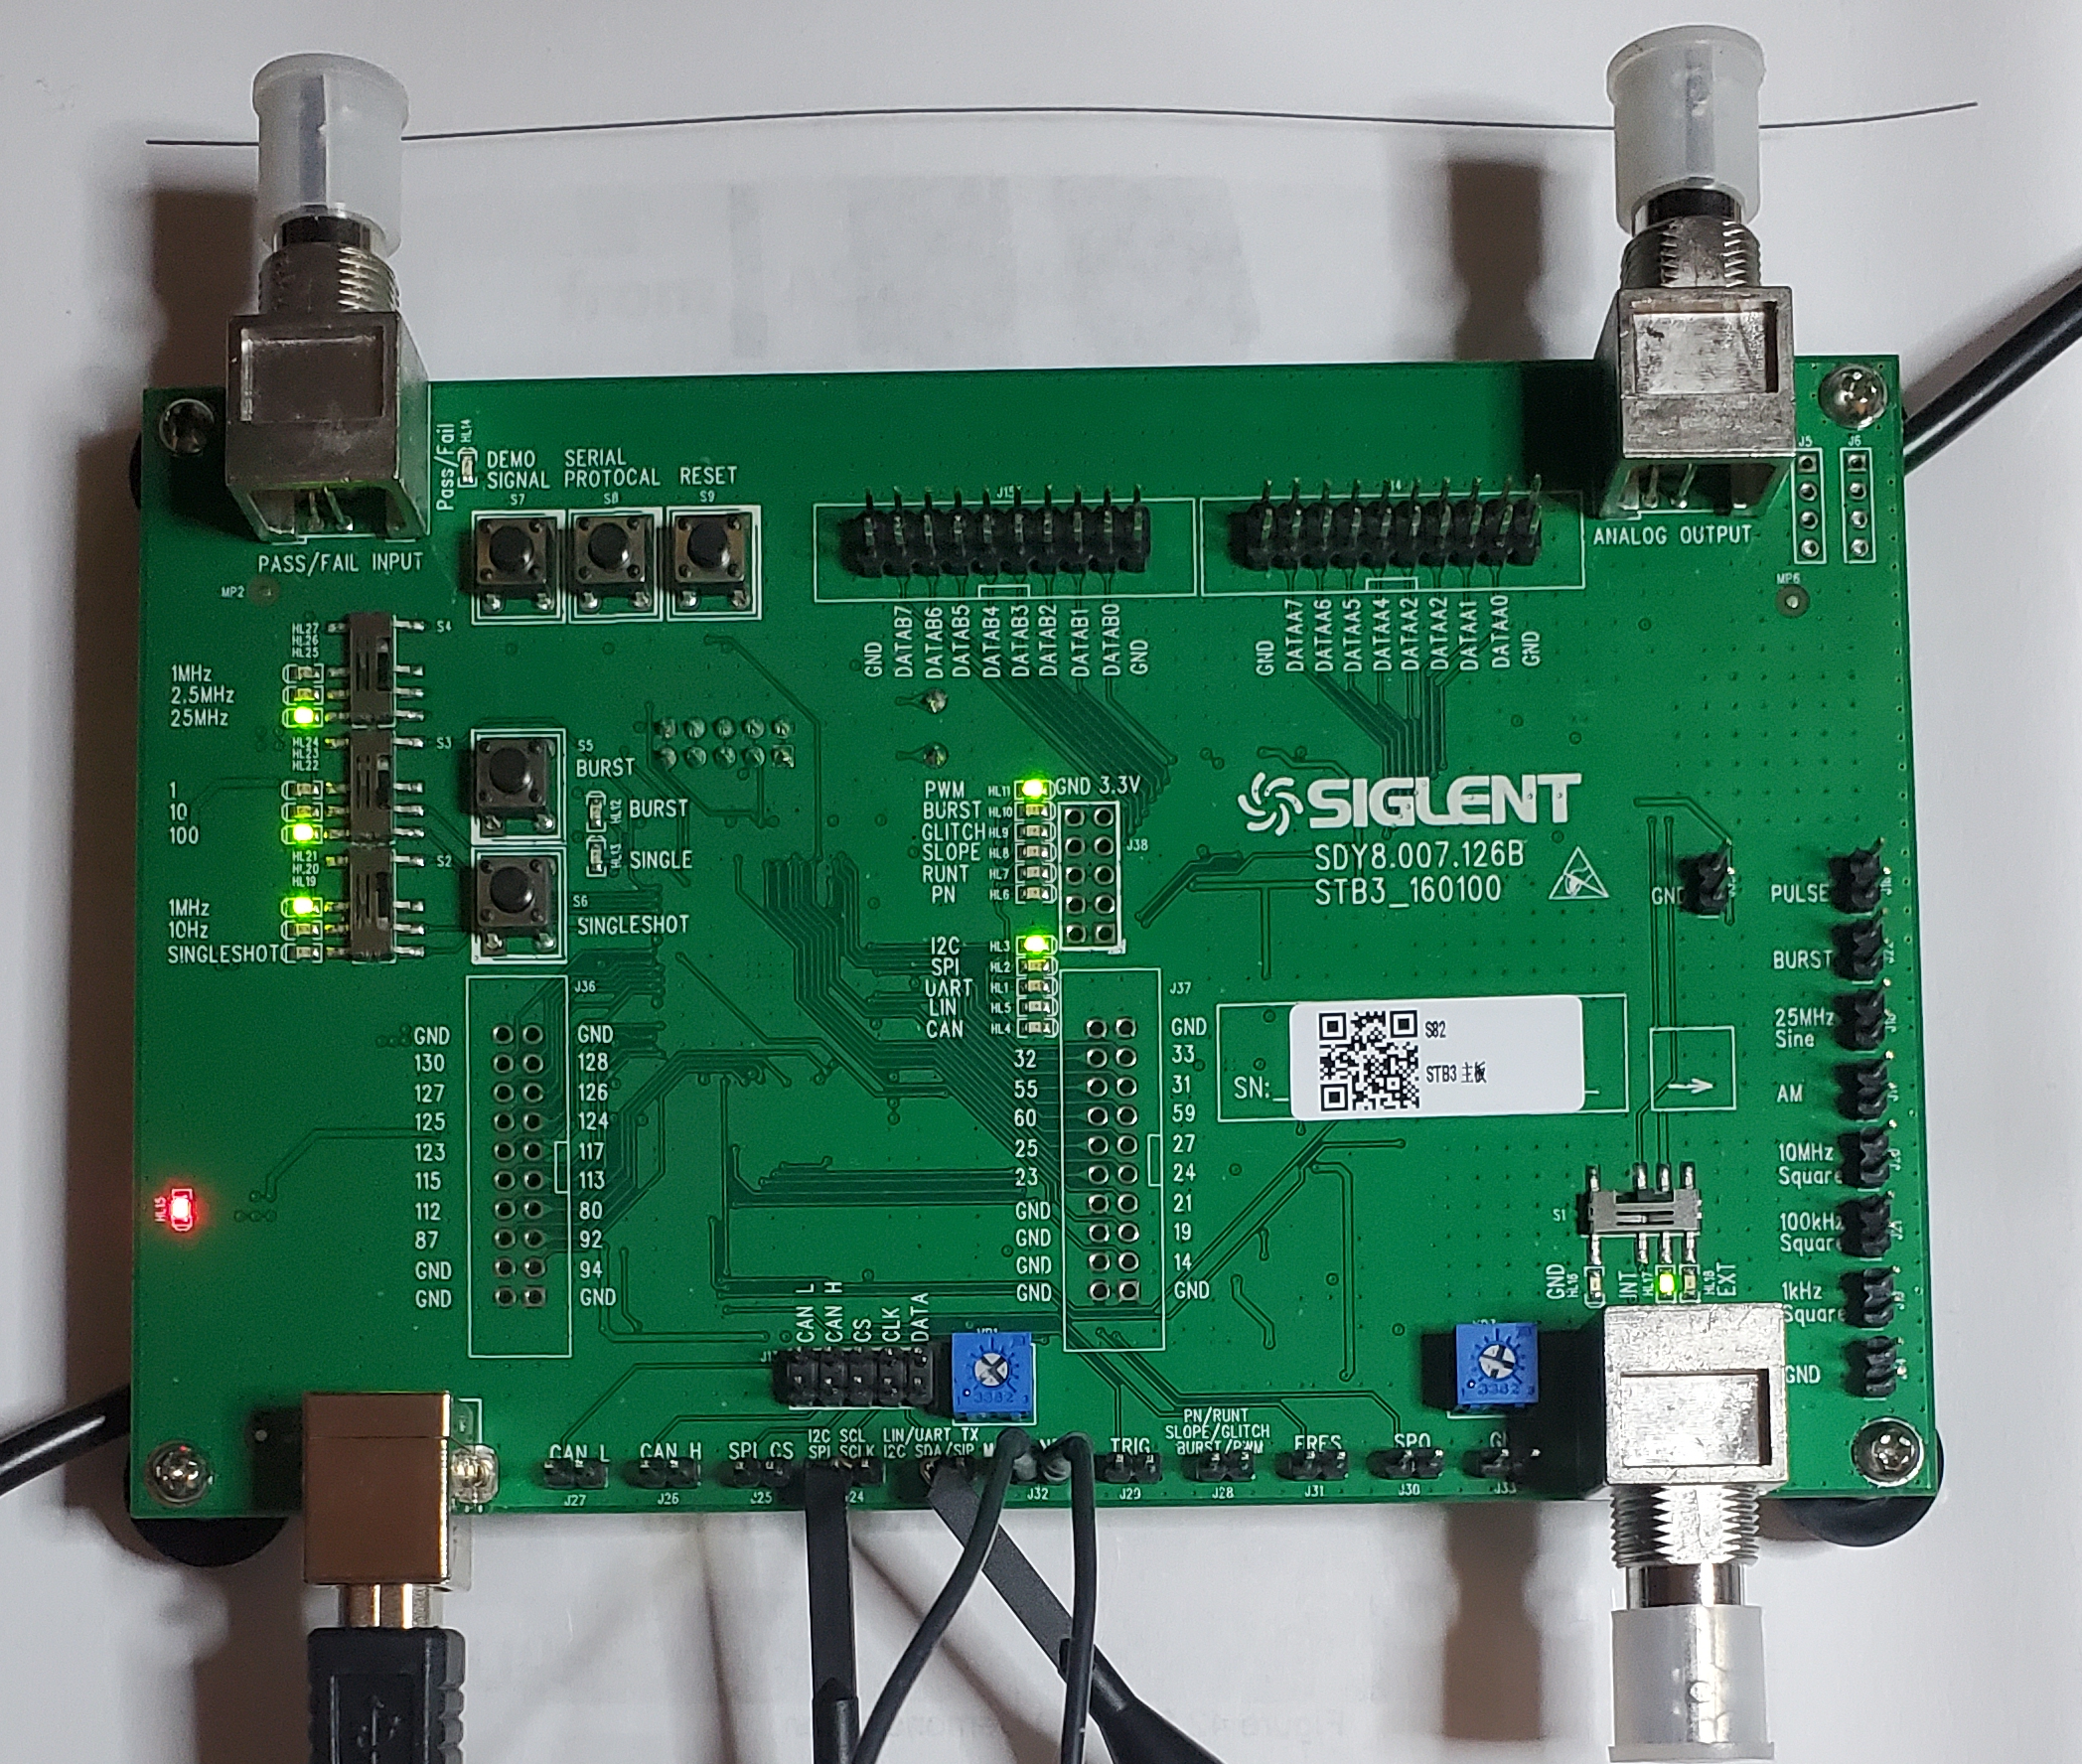
Hardware-Based High Speed Pass/Fail function View more
Hardware-Based High Speed Pass/Fail function
The SDS2000X-E utilizes a hardware-based Pass/Fail function, performing
up to 40,000 Pass / Fail decisions each second. Easily generate user
defned test templates provide trace mask comparison making it suitable
for long-term signal monitoring or automated production line testing.
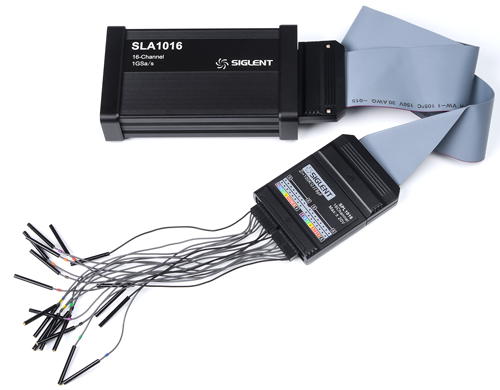
16 Digital Channels/MSO (option) View more
16 Digital Channels/MSO (option)
16 digital channels enables users to acquire and trigger on digital input
channels and view both digital and analog waveforms simultaneously
with one instrument.
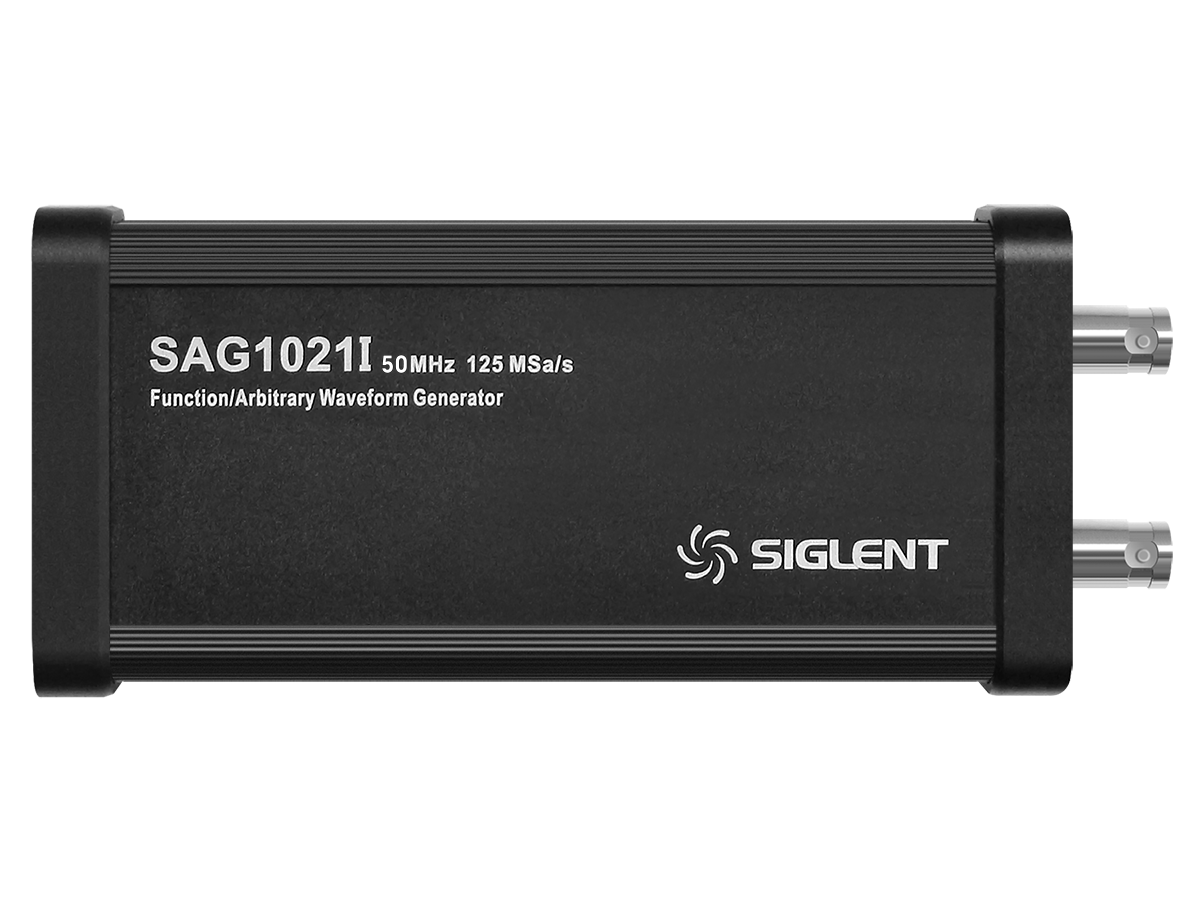
USB 25 MHz AWG Module (option) View more
USB 25 MHz AWG Module (option)
16 digital channels enables users to acquire and trigger on digital input
channels and view both digital and analog waveforms simultaneously
with one instrument.
Search and Navigate View more
Search and Navigate
The SDS2000X-E can search events specified by the user in a frame. It
can also navigate by time (delay position) and historical frames.
Bode Plot View more
Bode Plot
SDS2000X-E oscilloscope can control the USB AWG module or an independent SIGLENT SDG instrument, scan a circuits amplitude and phase frequency response, and display the data as a Bode Plot. It can also show the result lists, and export the data to a USB disk.
Web control View more
Web control
With the new embedded web server, users can control the SDS2000X-E
from a simple web page. This provides wonderful remote troubleshooting
and monitoring capabilities. The web page has PC and mobile styles that
include an embedded virtual control panel.
Real-time update screen in web page View more
Real-time update screen in web page
With 100 Mbps LAN, the internal web page can update at a rate of up to
10 times/s, providing a nearly-real time update of waveform data and
measurements. When viewed on a PC, the screen can be displayed in
full screen mode. With this feature and a PC VGA interface, you can
easily use a projector or other video display device to deliver the screen
information to a larger audience.
Complete Connectivity View more
Complete Connectivity
SDS2000X -E supports USB Host, USB Device (USB -TMC), LAN, Pass/Fail and Trigger Out.
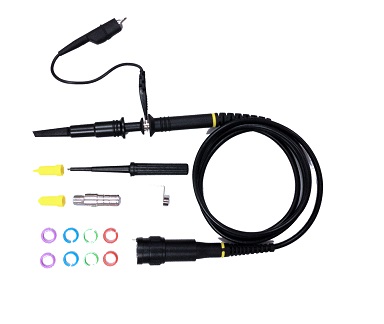
Standard Accessories
USB Cable
Quick Start Guide-SDS2KX-E
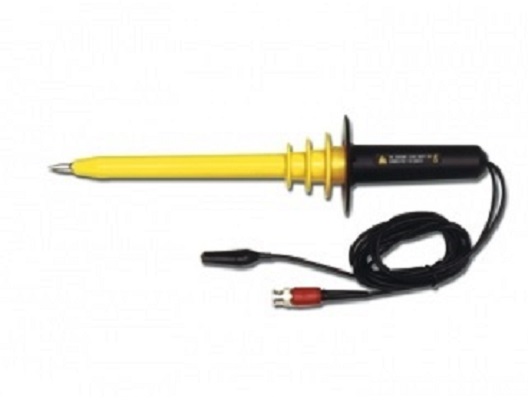
200 MHz models: PP215 Probes 350 MHz models: SP2035 Probes